Big USD sell-off marks potential for more to come
USD: Weak CPI prompts larger than expected drop
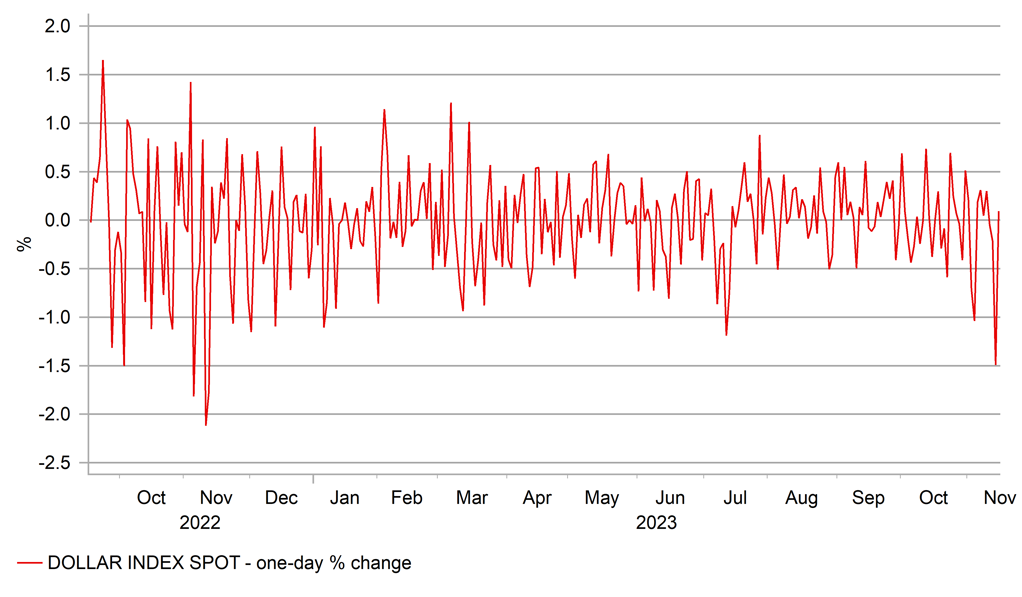
The divergence from consensus of the US CPI data for October was only 0.1ppt for both the headline and the core but sparked the largest sell-off of the US dollar since (coincidentally) the same October CPI report in November 2022. On that occasion the DXY index dropped by over 2.0% and 1.8% over two days whereas yesterday, the drop amounted to 1.5%. That sell-off a year ago did mark a turn for the US dollar that extended that initial two-day drop by a further 5.5% through to the intra-day low recorded in early February 2023. We suspect the scale of the sell-off of the dollar yesterday could also prove meaningful and mark another turning point that sees the dollar extend this weakness further.
Of course there are differences in November 2023 vs 2022 that suggest we shouldn’t necessarily expect the scale of sell-off this time. A 5-6% further sell-off of the dollar would equate to EUR/USD reaching potentially close to the 1.1500-level. Last year, the Nov 2022 CPI was the first turning point in the relentless surge in inflation while the global growth optimism got a considerable lift by the emergence of Chine re-opening optimism that saw China stocks begin a strong rally and USD/CNY drop sharply as expectations of a policy shift from China picked up. PMIs in the euro-zone also picked up over a three-month period to January 2023 reinforcing better global growth sentiment. That global growth optimism then is certainly not the case now and hence we would not expect the same scale of dollar selling going forward now compared to a year ago.
Still, the move itself certainly opens up the scope for further dollar weakness from here. Technically, the backdrop for the dollar is decidedly bearish. The 100-day and 200-day moving averages levels were breached yesterday – the last time both were breached on the same trading day was in June 2021 when EUR/USD had just peaked after the post-covid rally and saw EUR/USD decline from over 1.2100 to a low close to 0.9500 15mths later.
The fundamental trigger yesterday – the inflation data – was certainly compelling. We mentioned above the divergence from consensus was only 0.1ppt but the breakdown of the data certainly suggests scope for continued deceleration. The supercore CPI (core services less housing) m/m rate slowed from 0.61% in September to 0.22% in October. The annual rate slowed to 3.75%, the weakest growth rate since December 2021. Annualised over the last seven months, the supercore rate fell to 3.0%, close to the 10-year average of 2.75%. The core CPI rate excluding housing fell to 2.05% on an annual basis while the core goods CPI annual rate remained at 0% for the second month – the weakest since 2020. All of this weakening data and shelter – the biggest single component of core CPI – is still running at 6.7% and is very likely to decline notably based on actual rental data.
So the Fed is now even more likely finished its tightening cycle. A rate cut by May 2024 is now an 80% probability with 85bps priced by November 2024. There remains plenty of scope for further cuts to be priced if the activity data starts to weaken and in those circumstances EUR/USD advancing to the 1.1500-level in 2024 is very feasible.
LARGEST ONE-DAY DROP IN DXY SINCE OCT CPI RELEASE IN NOV 22

Source: Macrobond
GBP: And UK inflation adds to easing inflation concerns
The CPI data for October has just been released from the UK and similar to the US yesterday, the actual readings have come in 0.1ppt weaker than market consensus. However, the declines in headline inflation from the previous month were far larger than in the US reflecting the change in utility prices due to the OFGEM utility price increase of 80% in October 2022 falling out of the annual calculation. As a result, the electricity, gas and other fuels component in housing fell from +5.0% YoY to -21.6%. This drop was well known and hence the drop in the headline YoY rate from 6.7% to 4.6%, the weakest reading since October 2021. The core rate remains stickier but still dropped from 6.1% to 5.7%, the weakest reading since February 2022.
The breakdown of the data does still show high levels of inflation across most sectors and hence is unlikely to drive expectations of rates cuts like what we had in the US yesterday. Food, alcohol and tobacco accounts for about 15% of the index and is still running at a double-digit YoY rate at 10.3%. This component will be slow to drop dramatically through to Q2 2024 given the large MoM increases recorded in Q1 this year. Nonetheless, the momentum remains clearly to the downside following the peak of 16.0% in April. Every other key sector within CPI is still running well above 2.0% apart from Transportation (0.50% YoY).
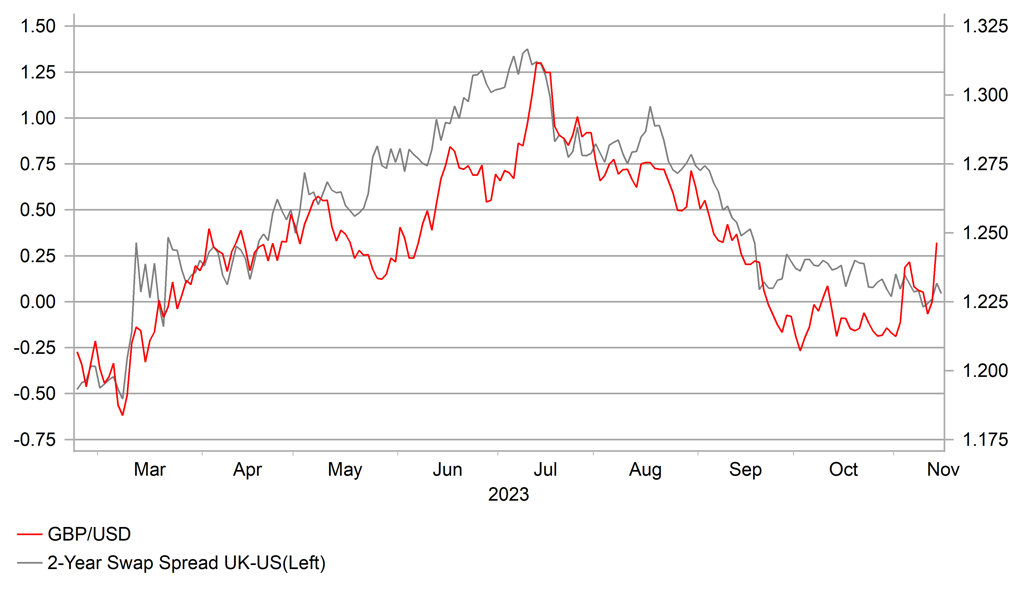
However, this sharp drop in CPI will reinforce the expectations of the end of monetary tightening in the UK. GBP performance remains linked to global risk appetite to some degree and hence the sharp drop in global yields and the positive impact on equities yesterday helped support GBP with EUR/GBP moving marginally lower. Beyond the US dollar we remain cautious on the scope for GBP to outperform given the monetary policy impact looks to be weighing down more on the real economy and mild recession looks likely in the coming quarters.
GBP/USD GAIN BUT LIMITED SPREAD MOVE

Source: Macrobond & Bloomberg
KEY RELEASES AND EVENTS
|
Country |
GMT |
Indicator/Event |
Period |
Consensus |
Previous |
Mkt Moving |
|
IT |
09:00 |
Italian HICP (YoY) |
Oct |
1.9% |
5.6% |
! |
|
IT |
09:00 |
Italian HICP (MoM) |
Oct |
0.2% |
1.7% |
! |
|
UK |
09:30 |
House Price Index (YoY) |
-- |
0.3% |
0.2% |
! |
|
EC |
10:00 |
Industrial Production (YoY) |
Sep |
-6.3% |
-5.1% |
! |
|
EC |
10:00 |
Industrial Production (MoM) |
Sep |
-0.7% |
0.6% |
!! |
|
EC |
10:00 |
Trade Balance |
Sep |
-- |
6.7B |
! |
|
US |
12:00 |
MBA Mortgage Applications (WoW) |
-- |
-- |
2.5% |
! |
|
US |
13:30 |
NY Empire State Manufacturing Index |
Nov |
-2.60 |
-4.60 |
!! |
|
US |
13:30 |
PPI (YoY) |
Oct |
-- |
2.2% |
!! |
|
US |
13:30 |
PPI ex. Food/Energy/Transport (YoY) |
Oct |
-- |
2.8% |
!! |
|
US |
13:30 |
PPI (MoM) |
Oct |
0.1% |
0.5% |
!! |
|
US |
13:30 |
PPI ex. Food/Energy/Transport (MoM) |
Oct |
-- |
0.2% |
!! |
|
US |
13:30 |
Retail Control (MoM) |
Oct |
-- |
0.6% |
!!! |
|
US |
13:30 |
Retail Sales (MoM) |
Oct |
-0.1% |
0.7% |
!!! |
|
US |
13:30 |
Retail Sales (YoY) |
Oct |
-- |
3.75% |
! |
|
US |
13:30 |
Retail Sales Ex Gas/Autos (MoM) |
Oct |
0.1% |
0.6% |
!!! |
|
CA |
13:30 |
Manufacturing Sales (MoM) |
Sep |
0.0% |
0.7% |
! |
|
CA |
13:30 |
Wholesale Sales (MoM) |
Sep |
0.0% |
2.3% |
! |
|
US |
15:00 |
Business Inventories (MoM) |
Sep |
0.3% |
0.4% |
!! |
|
US |
15:00 |
Retail Inventories Ex Auto |
Sep |
0.3% |
0.5% |
!! |
|
UK |
18:00 |
MPC Member Haskel Speaks |
-- |
-- |
-- |
!!! |
Source: Bloomberg

