

US data flows to threaten USD resilience
USD: Retail sales report adds to recent run of softer US economic data
The US dollar remained under downward pressure at the end of last week alongside short-term US yields. The 2-year US Treasury hit a fresh low on Friday at 4.10% as it continues to move further below the high from last month at 4.37%. At the same time, the slope of the US yield curve has continued to steepen as yields at the long end of the curve have remined close to year-to-date highs. The steeping of the US yield curve driven by the move lower for short-term US yields is creating an unfavourable backdrop for US dollar performance although it has not been sufficient yet to trigger another leg lower for the dollar index so far this month. The dollar index has not yet tested support from the 200-day moving average which comes in at around 99.200. US dollar performance over the past week has been mixed (click here). The best performers have been the oil-related G10 currencies of the Norwegian krone and Candina dollar, while the yen and Swiss franc have underperformed. The krone and Canadian dollar have benefited from higher energy prices, reflecting the lack of progress in reopening the Strait of Hormuz. The International Energy Agency (IEA) released its latest monthly oil market report last week, warning that the global oil market is now expected to record a deficit of 1.8 mb/d in Q3, more than double its initial estimate of around 800 kb/d in July's report.
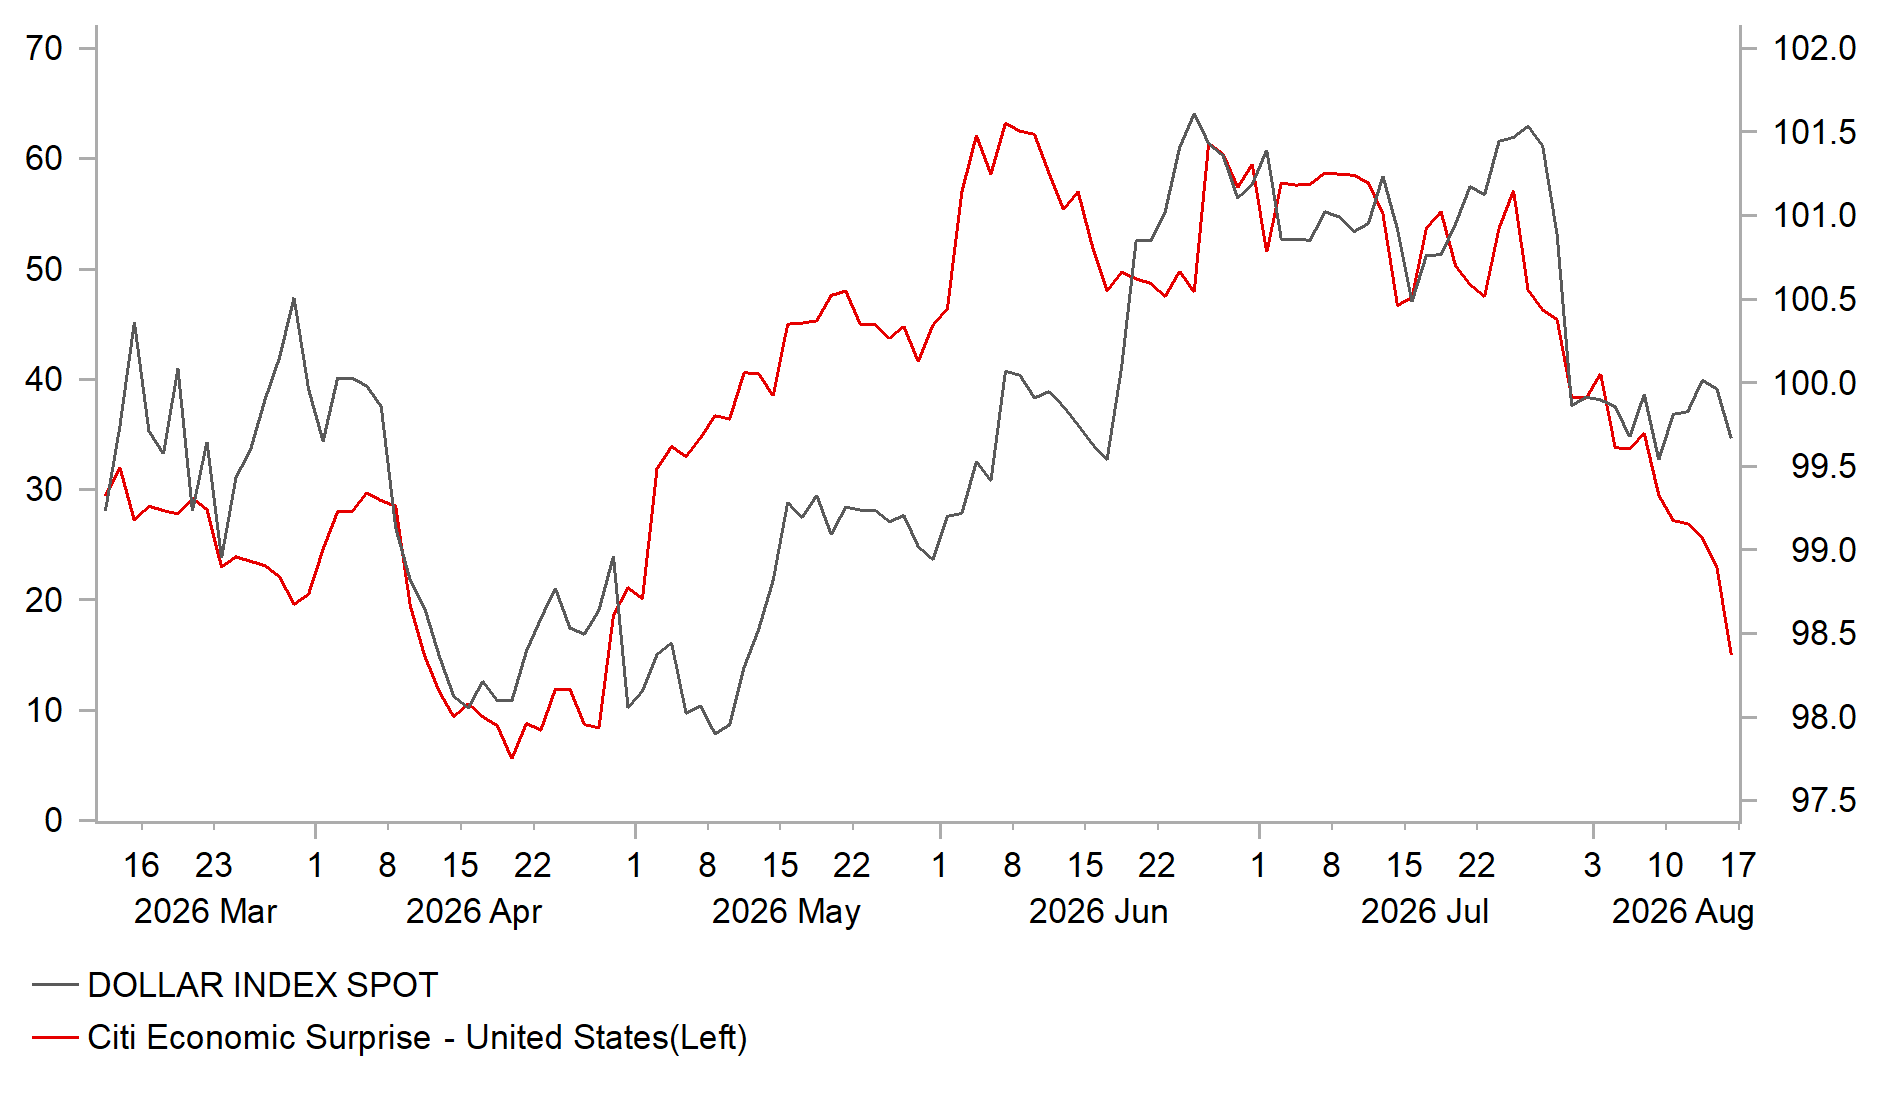
The ongoing correction lower for short-term US yields was reinforced at the end of last week by the release of the much softer than expected US retail sales report for July. It extends the recent run of weaker US economic data including the NFP and CPI reports for July. According to Bloomberg, Citi’s US economic surprise index has fallen sharply since late in July and is now at the lowest level since late April. The run of softer US economic data has encouraged market participants to scale back Fed rate hike expectations. On 24th July, the US rates market was pricing in around 57bps of Fed hikes by April of next year including a hike in September which was fully priced. Fast forward to today and the US rate market is now pricing in around 34bps of Fed hikes by April including 7bps of hikes by September. Fed Chair Kevin Warsh wanted market participants to make up their mind about how the Fed should react to changing economic conditions rather be guided by forward guidance, and they are currently sending a clear signal that there is less need for the Fed to hike rates.
Looking at the latest US retail sales report in more detail it revealed that core retail sales unexpectedly contracted by -0.4% in July following a downwardly revised expansion of 0.4% in June. Weakness was driven mainly by non-store retailers. It was the weakest monthly reading for core retail sales since January 2025 at the start of President Trump’s second term. It follows an unusually strong period of growth over the previous five months when core retail sales increased by an annualized rate of 8.4% compared to an annualized rate of around 4.8% over the prior two years. It suggests some overdue payback weakness in July. This will add to concerns that consumer spending growth could slow further during the second half of this year.
Consumer spending had already slowed to an annualized rate of 1.9% in the first half of this year down from 2.3% over the last year. President Trump’s One Big Beautiful Bill is likely to remain supportive for aggregate household incomes through 2026 via permanent tax cuts and temporary deductions. However, the incremental boost to consumer spending could fade in the second half of the year as the initial tax benefits are absorbed and spending restraint associated with Medicaid and SNAP reforms becomes more apparent. Overall, recent developments are supportive of our forecasts (click here) for the US dollar to re-weaken modestly heading into next year.
US ECONOMIC SURPRISE INDEX VS. DOLLAR INDEX
Source: MUFG Research, Macrobond, Bloomberg
JPY: Weaker GDP but yields move higher
JGB yields are higher today despite the release of weaker than expected real GDP data today in Japan. Annualised Q2 real GDP grew by 1.1% Q/Q, down from 1.9% in Q1 and below the consensus of 2.0%. There were two clear areas of weakness – business investment which fell sharply by 1.2% Q/Q and personal consumption which was flat in contrast to the consensus for a 0.4% gain (both non-annualised). Inventories and net exports were the areas of growth. This is certainly a weaker GDP report and will provide a challenge to the messaging from hawks at the central bank pushing for a more aggressive rate hiking path. In particular, the business investment backdrop was indicative of a corporate sector that is weaker than generally assumed based on other business sentiment data.
An argument can still be made though that the focus should be on price stability and that with the monetary stance still loose, further hikes at upcoming meetings are still justified. Tackling inflation can in turn help consumer sentiment and that can translate to better consumer spending. That seems to be the view of market participants today that have instead focused on the reports at the end of last week that indicated the BoJ is set to push ahead with sooner rate hikes with the support of PM Takaichi and the government. The 10-year JGB yield advanced by 3-4bps today, reaching a level not seen since 1996. The pricing for a 25bp hike at the next meeting in September remains elevated, implying around an 80% probability of a hike. There has been no public comment today from the MoF or BoJ to push back on the pricing in the rates market that further reinforces the credibility of the BoJ story last week. Indeed, a former MoF Vice Finance Minister (Takehike Nakao) stated today that the BoJ needed to hike at consecutive meetings in order to normalise monetary policy.
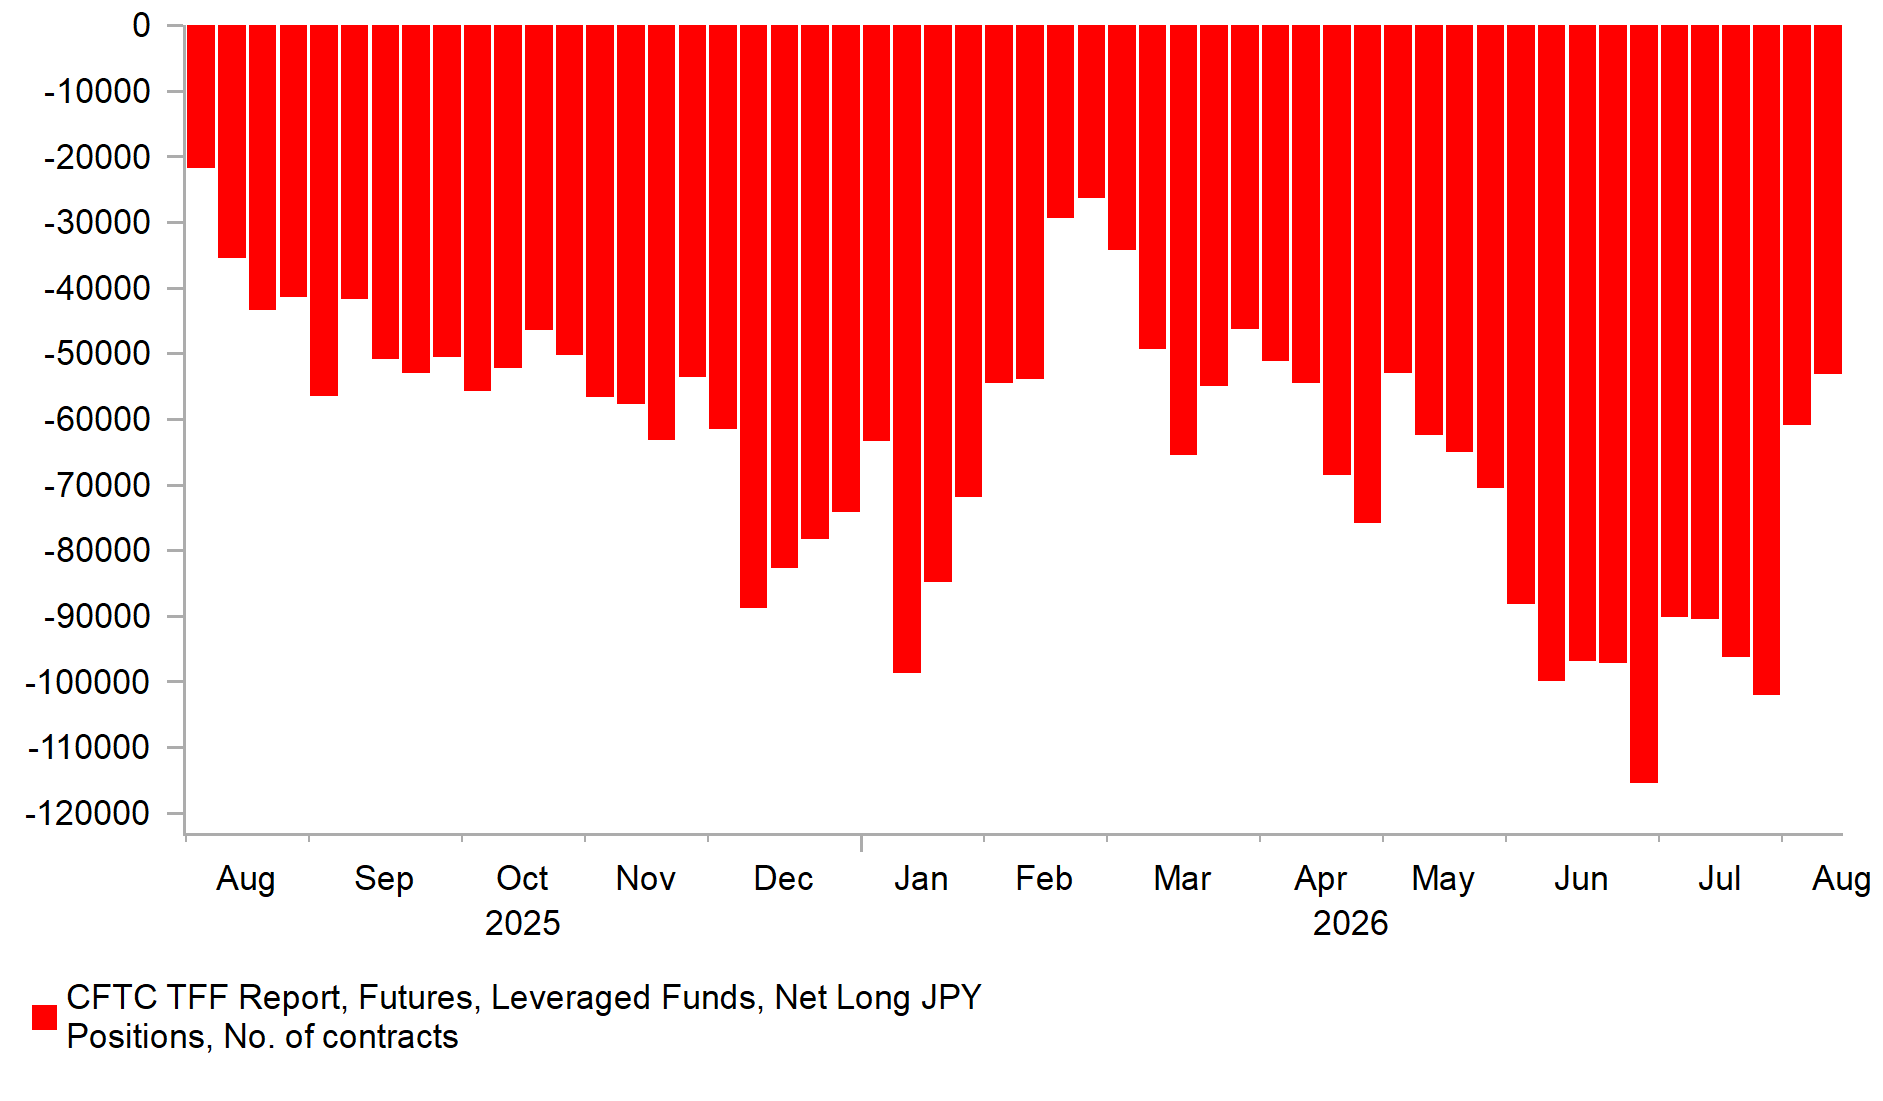
The IMM positioning data to last Tuesday was released on Friday and as can be seen below, there was a further liquidation of yen short positions amongst Leveraged Funds fuelled by the joint intervention by Japan and the US on 30th/31st July. There has clearly been some yen selling from other areas of the market given the yen has weakened back since intervention and the scale of liquidation was modest compared to the previous week. Weaker US data and BoJ pricing for a hike in September will help to curtail renewed yen selling over the short-term.
LEVERAGED FUNDS CONTINUED TO PARE BACK JPY SHORTS
Source: Bloomberg, Macrobond, MUFG Research
KEY RELEASES AND EVENTS
Country | BST | Indicator/Event | Period | Consensus | Previous | Mkt Moving |
EC | 10:30 | ECB's Lane speaks | - | !!! | ||
US | 13:30 | Empire Manufacturing Index | Aug | 10.5 | 15.6 | !! |
CA | 13:30 | CPI MoM | Jul | 0.40% | -0.40% | !! |
CA | 13:30 | CPI YoY | Jul | 2.90% | 2.80% | !! |
CA | 13:30 | CPI Ex-Food & Energy YoY | Jul | 1.80% | 1.80% | !!! |
CA | 13:30 | CPI Core - Median YoY | Jul | 1.90% | 1.90% | !!! |
CA | 13:30 | CPI Core - Trim YoY | Jul | 1.80% | 1.80% | !!! |
US | 15:00 | NAHB Housing Market Index | Aug | 33 | 34 | !! |
US | 21:00 | Total Net Tic Flows | Jun | - | $132.2bn | !! |
Source: Bloomberg & Investing.com