

To read the full report, please download PDF.
AI & G10 FX implications
FX View:
The US dollar is stronger versus all G10 currencies over the period since the Nasdaq 100 peaked at a record high on 6th October. The yen is performing only marginally worse than the dollar (-0.4%) underlining the potential for the yen safe-haven characteristics to return in an AI-related risk-off. Macroeconomic exposures to AI don’t necessarily translate to FX performance with Japan’s equity markets and economy more exposed to AI but the yen potentially being a solid performer if this risk-off extends further. Australia though, which has greater macroeconomic exposure to AI has performed poorly but the move is reinforced by the commodities sell-off and the high-beta nature of AUD performance. Can the US dollar to continue to perform well if the AI sell-off persists? The US is more exposed than any other country and at some point investors will likely question the extent of Fed tightening currently priced – that would likely be the catalyst for US dollar underperformance, certainly against core G10. The commodities sell-off has also intensified reinforcing the underperformance of AUD and NOK with the potential for further declines.
JPY & CHF OUTPERFORM AS RISK-OFF INTENSIFIES
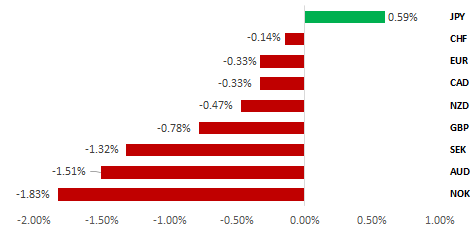
Source: Bloomberg, as of 20th November 2026 14.00 GMT (Weekly % Change vs. USD)
Trade Ideas:
We are recommending a new short USD/CHF trade idea and taking profit on our short AUD/JPY trade idea.
JPY Flows:
The Balance of Payments data for September revealed a worsening trade deficit, in part due to energy and selling of US bonds by Japanese investors.
FX Correlation Heatmaps:
The sharp move higher in US rates has been encouraging a stronger USD over the past month. The G10 FX pairs that have had the strongest correlations to US rates have been USD/CHF and USD/JPY followed by GBP/USD. In contrast, AUD/USD and NZD/USD have little to no correlation to US rates.
FX Views
USD: Risk-off, US dollar stronger to hold for now
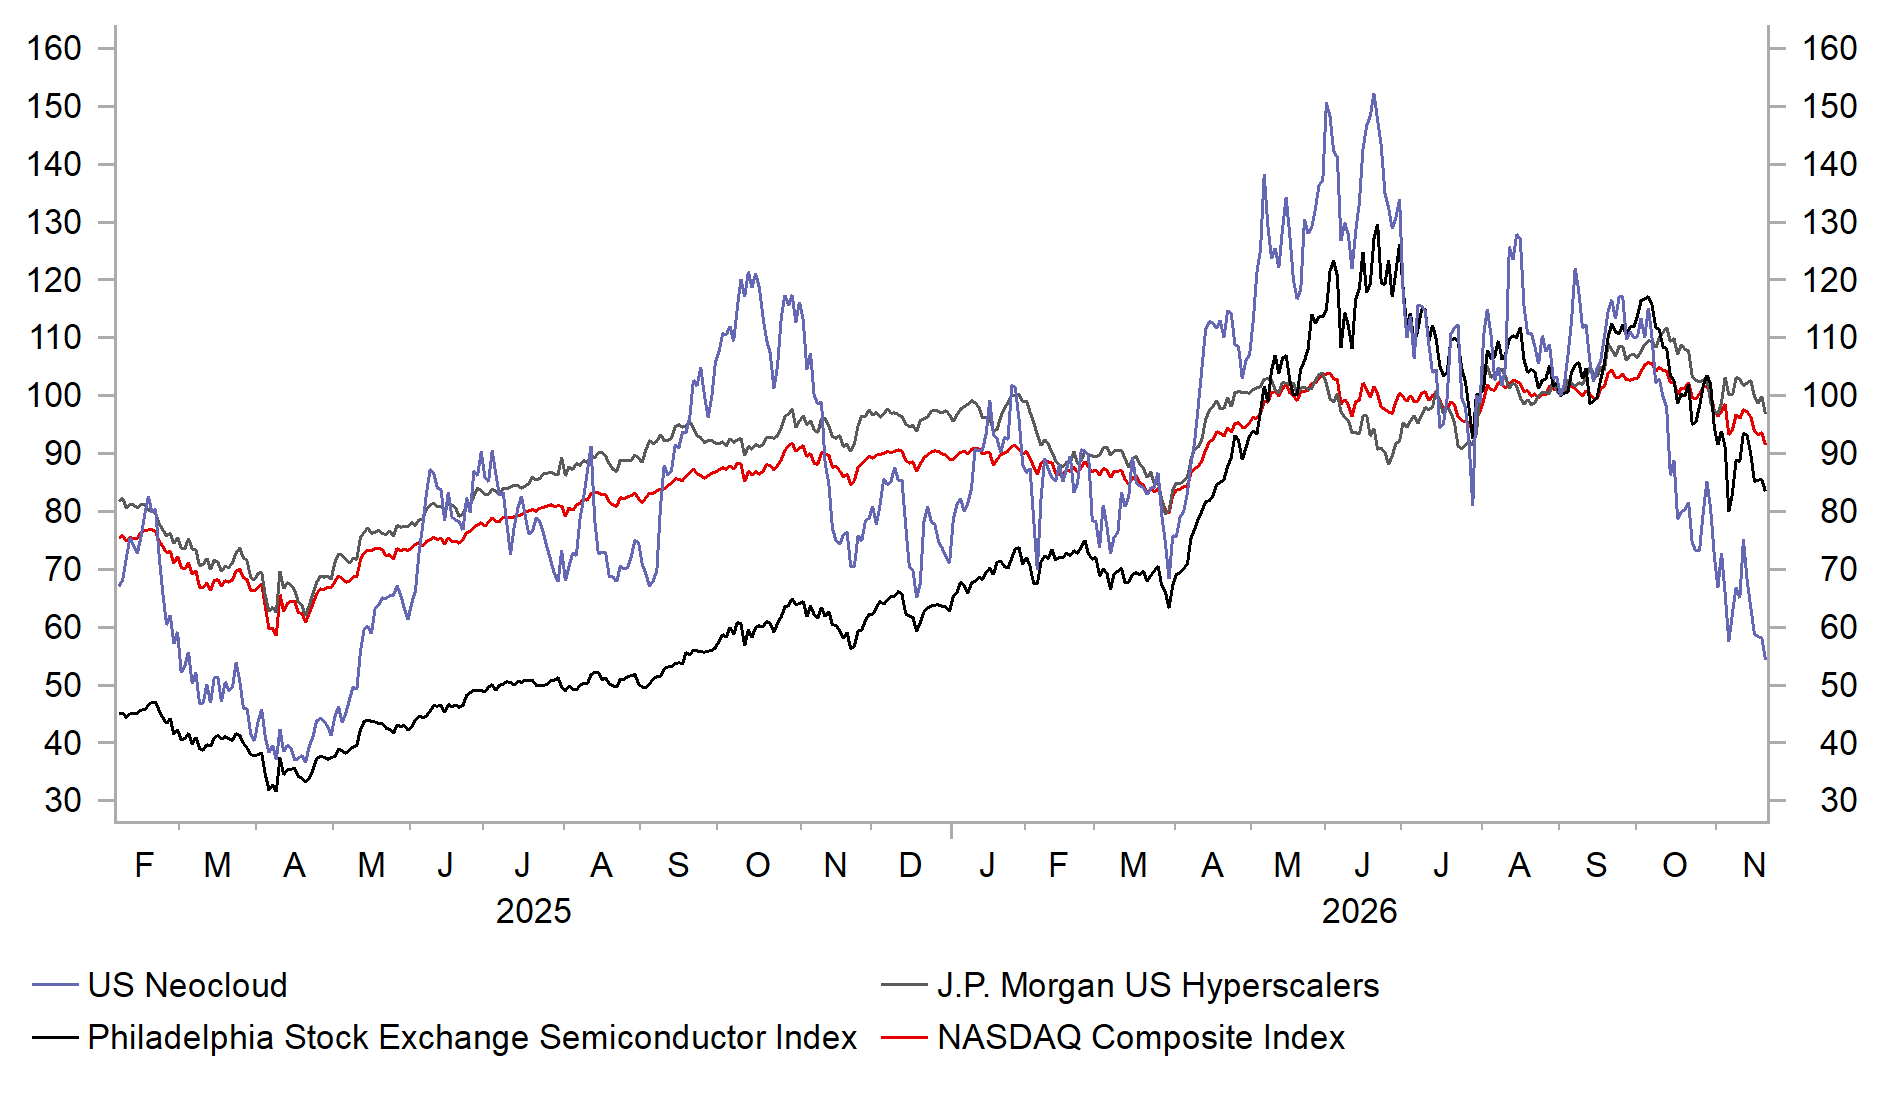
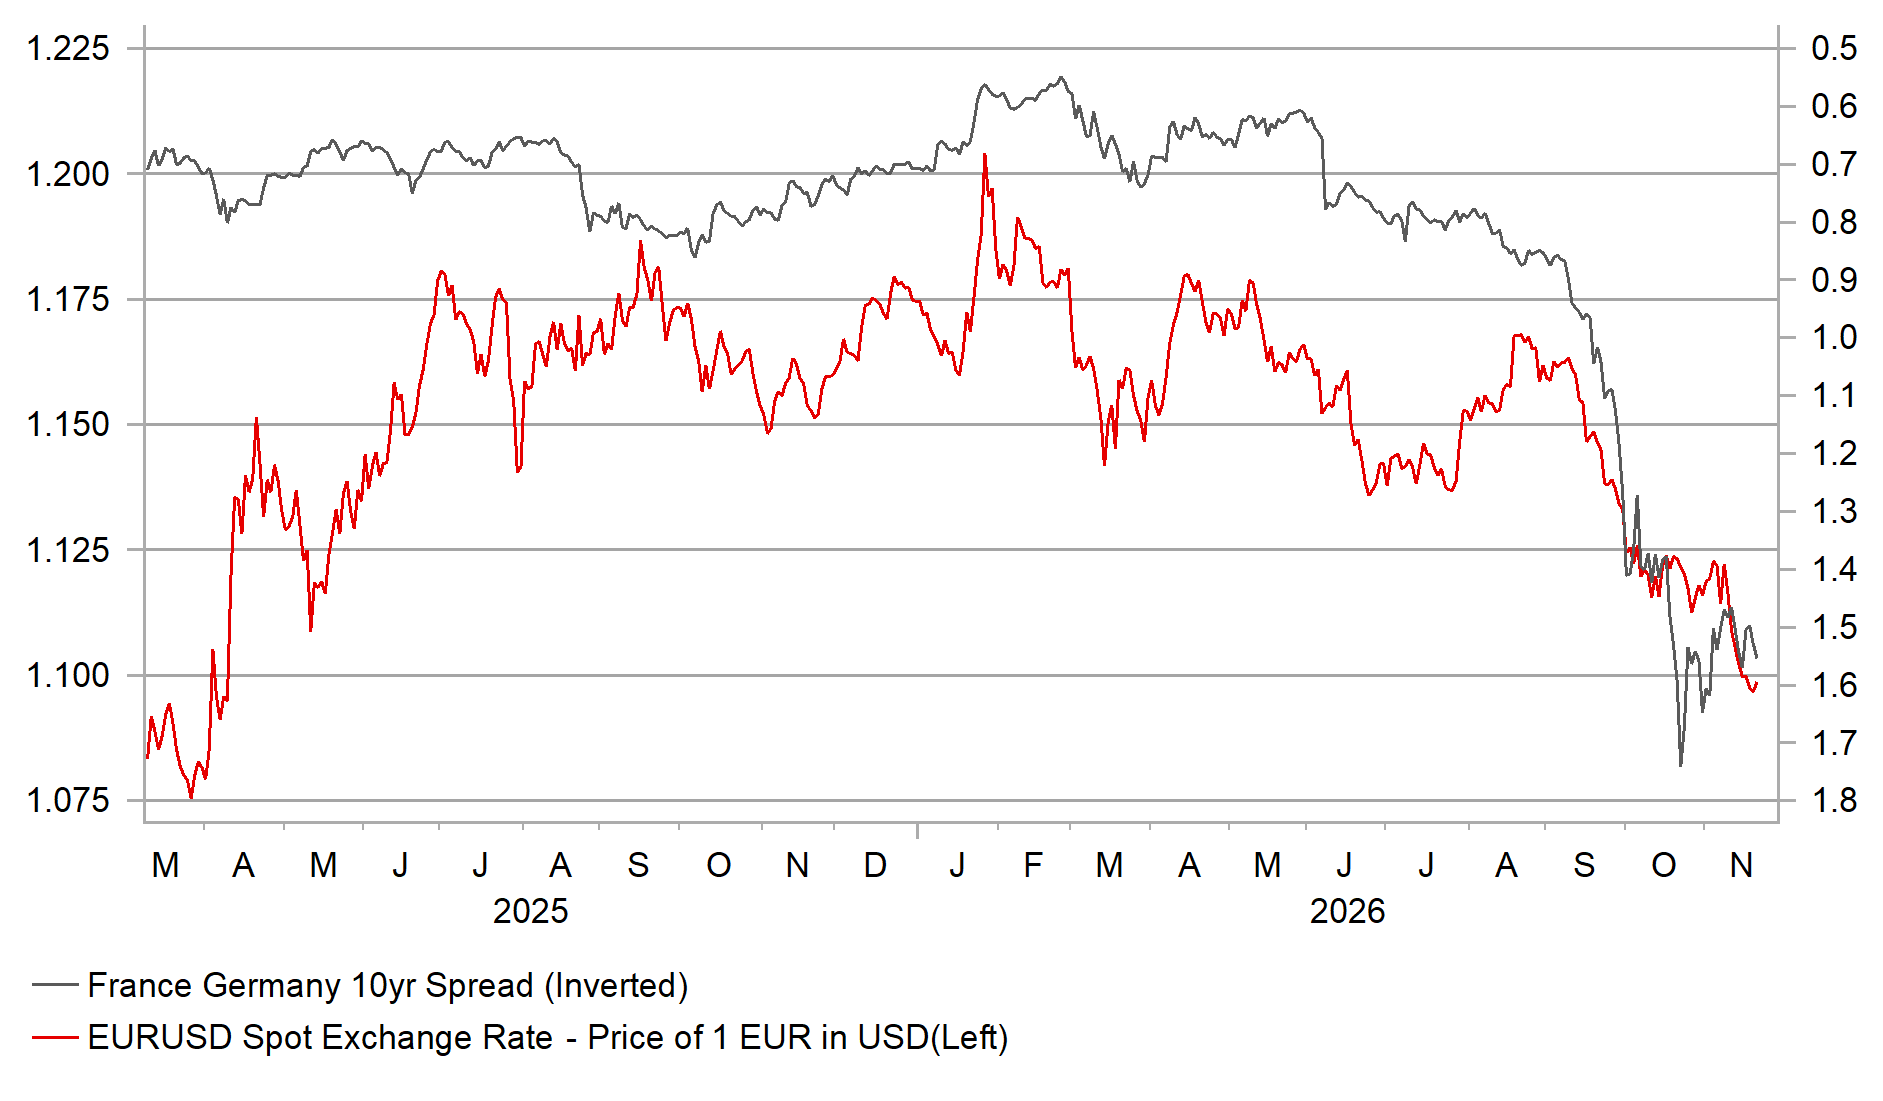
The Nasdaq 100 is now down by just over 15% from the intra-day record high recorded on 6th October with the Anthropic IPO and first day trading yesterday failing to halt the deteriorating risk sentiment. The 6.4% plunge on 5th November was the largest one-day drop since 16th March 2020 at the start of covid underlining the worsening sentiment. The US dollar is the top performing G10 currency over the period since that Nasdaq peak followed closely behind by the yen and Canadian dollar (both less than 1% weaker than the dollar). At the bottom of the performance table is the Australian dollar (-4.6% vs USD) and the euro (-2.6%). There are other market dynamics to consider in explaining FX performance – crude oil was volatile over that period surging to over USD 110pbl and then plunging over 20% but the net move from 6th Oct is just 6.5%. Commodities more generally have dropped notably which adds to AUD underperformance but is of course also linked to the AI trade. Finally, for the euro, the OAT/Bund spread surged to a new high in October before partially retracing that move. Can we expect G10 FX to continue performing as we have seen since the peak in tech on 6th Oct or are there signs of changes that suggests a different performance for certain G10 currencies going forward?
The bigger drop for AUD does point to more limited scope for a further move lower from here. Still, nearly all inputs for the currency are now negative and that does suggest scope for further declines from here. Australia’s macro exposure to AI is higher than in many other G10 countries that reinforces the downside risks emanating from the commodities sell-off and AUD high-beta characteristics. While AUD is the worst performer since the tech peak on 6th October, it is the second best performing G10 currency on a year-to-date basis. Appreciation fuelled by RBA getting ahead of the curve in tightening is quickly turning to risks that the RBA has gone too far. Data Centre Magazine reported in August that the Australian Energy Market Operator (AEMO) forecasts that datacentre electricity consumption would jump from 5TWh in 2025-26 to 34TWh by 2035-36 with the share of the national grid jumping from around 3% to 13%. It also reported that Australia was second only to the US in datacentre investment volumes in 2024. As of June this year, prospective datacentre projects generated around 67GW of grid connection requests across 225 projects, a YoY increase of 75%. So AUD downside risks is not just a view based on high-beta and falling commodity prices, but Australia’s high macro exposure. A move at least to the 0.6500-level if current market conditions continue is the least we can expect.
AI CORRECTION LOWER INTENSIFIES
Source: Bloomberg, Macrobond & MUFG GMR
FRANCE RISKS WERE AN INITIAL HIT FOR EUR
Source: Bloomberg, Macrobond & MUFG GMR
Since, the 6th Oct tech peak, the euro has performed poorly but this is more a reflection of France risks than AI risks. Since the OAT/bund spread peaked on 22nd Oct and retraced modestly lower, the euro is the third best performing G10 currency after the dollar and yen. Europe is well behind in AI investment roll outs. The OECD reported that for 2025, the US captured 75% of AI venture capital investment, some 12 times the EU27 total. The IEA estimates the increased datacentre electricity demand from 2024 to 2030 will be three times larger in the US than in Europe. France remains a downside risk for the euro-zone but based on pure AI risks, the euro should be positioned to outperform most of the rest of G10.
The yen is now close to performing as well as the US dollar since the tech peak on 6th Oct (-0.4% versus USD) and if the AI sell-off is to intensify further from here we would expect the yen to advance versus the dollar as well. Most of the risk offs we have had since the global inflation shock have taken place against a backdrop of US yields remaining elevated due to inflation risks. While the USD/JPY US-Japan front-end rate spread driver has been less reliable in the post-covid/global inflation shock era, the large moves lower in USD/JPY in the last four years have coincided with falls in the rate spread. In other words, there are large periods when USD/JPY has gradually moved higher while the yield spread has moved lower. However, if there is a sharper move in the yield spread, USD/JPY drops. Oct-22 to Jan-23; Nov-23 to Dec-23; Jul-24 to Sept-24; and Jan-25 to Apr-25 are all periods of notable USD/JPY declines that coincided with moves lower in the 2-year swap spread of 75bps or more in periods of 3mths or less. If this risk-off ultimately turns into a big move in rate spreads, we can expect the yen to outperform. This risk-off if it extends further and takes commodities further lower too will look much more deflationary/disinflationary than other risk-offs since the global inflation shock which would be to the benefit of the yen.
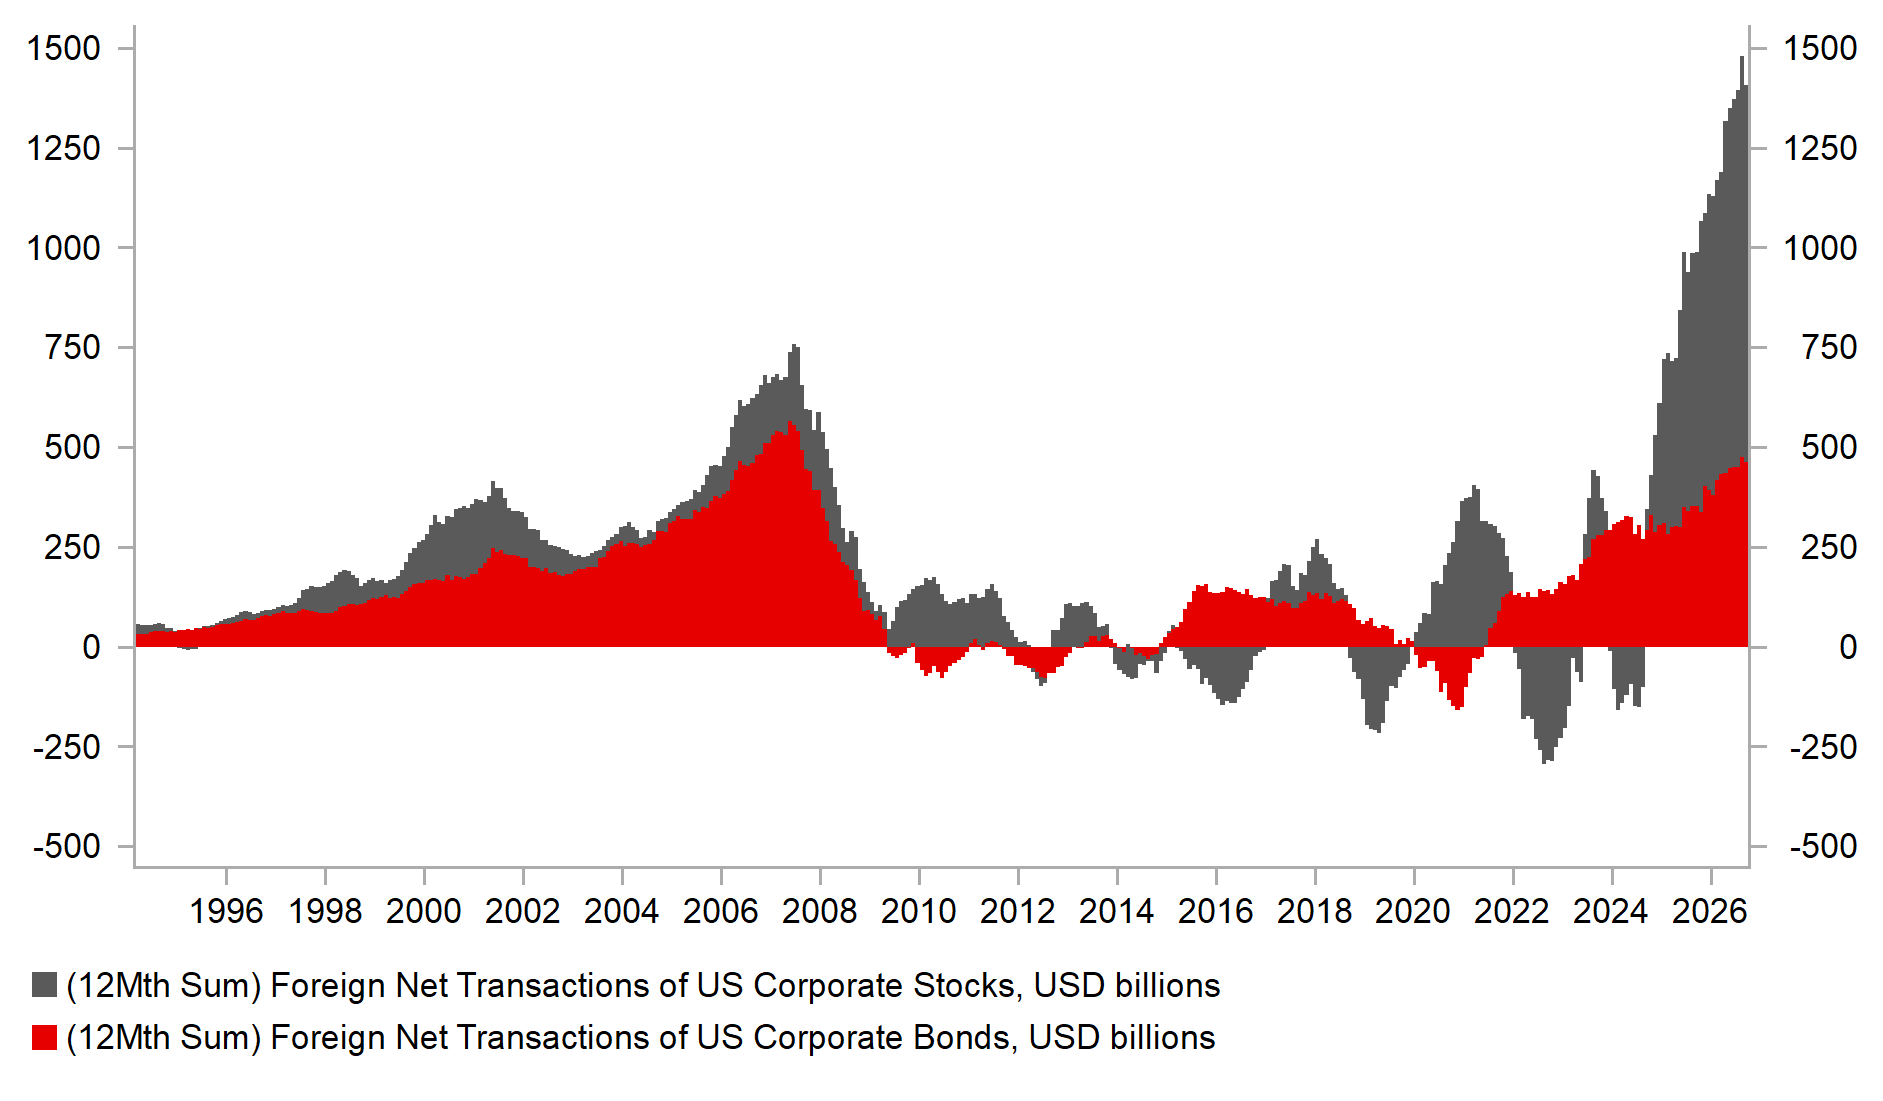
Given the scale of AI exposure to the performance of the US economy there is certainly question marks over the sustainability of the appreciation of the US dollar. In a further sell-off that turns into a credit risk event, there would likely be a rush for US dollars that would see the dollar advance further. But are unlikely close to that point. The below chart highlights that the correction in many AI-related indices have only retraced back to March-April levels (US Neoclouds a bigger drop). But the declines could certainly be enough to play a role in slowing growth and with it associated inflation risks. US consumption growth has been strong in recent quarters, at a time when real after-tax income is slowing – consumption growth looks vulnerable to a slowdown, especially as the Democrats push to slow momentum with greater regulatory restrictions in 2027. Three additional Fed rate hikes could quickly start to look unrealistic and a market reassessment of the extent of rate hikes in 2027 would be the catalyst for a turn for the US dollar, certainly against core G10, like the yen franc and euro.
HUGE US EQUITY INFLOWS COULD BE SET TO SUBSIDE
Source: Bloomberg, Macrobond & MUFG GMR
USD / VIX CORRELATION HAS REBOUNDED
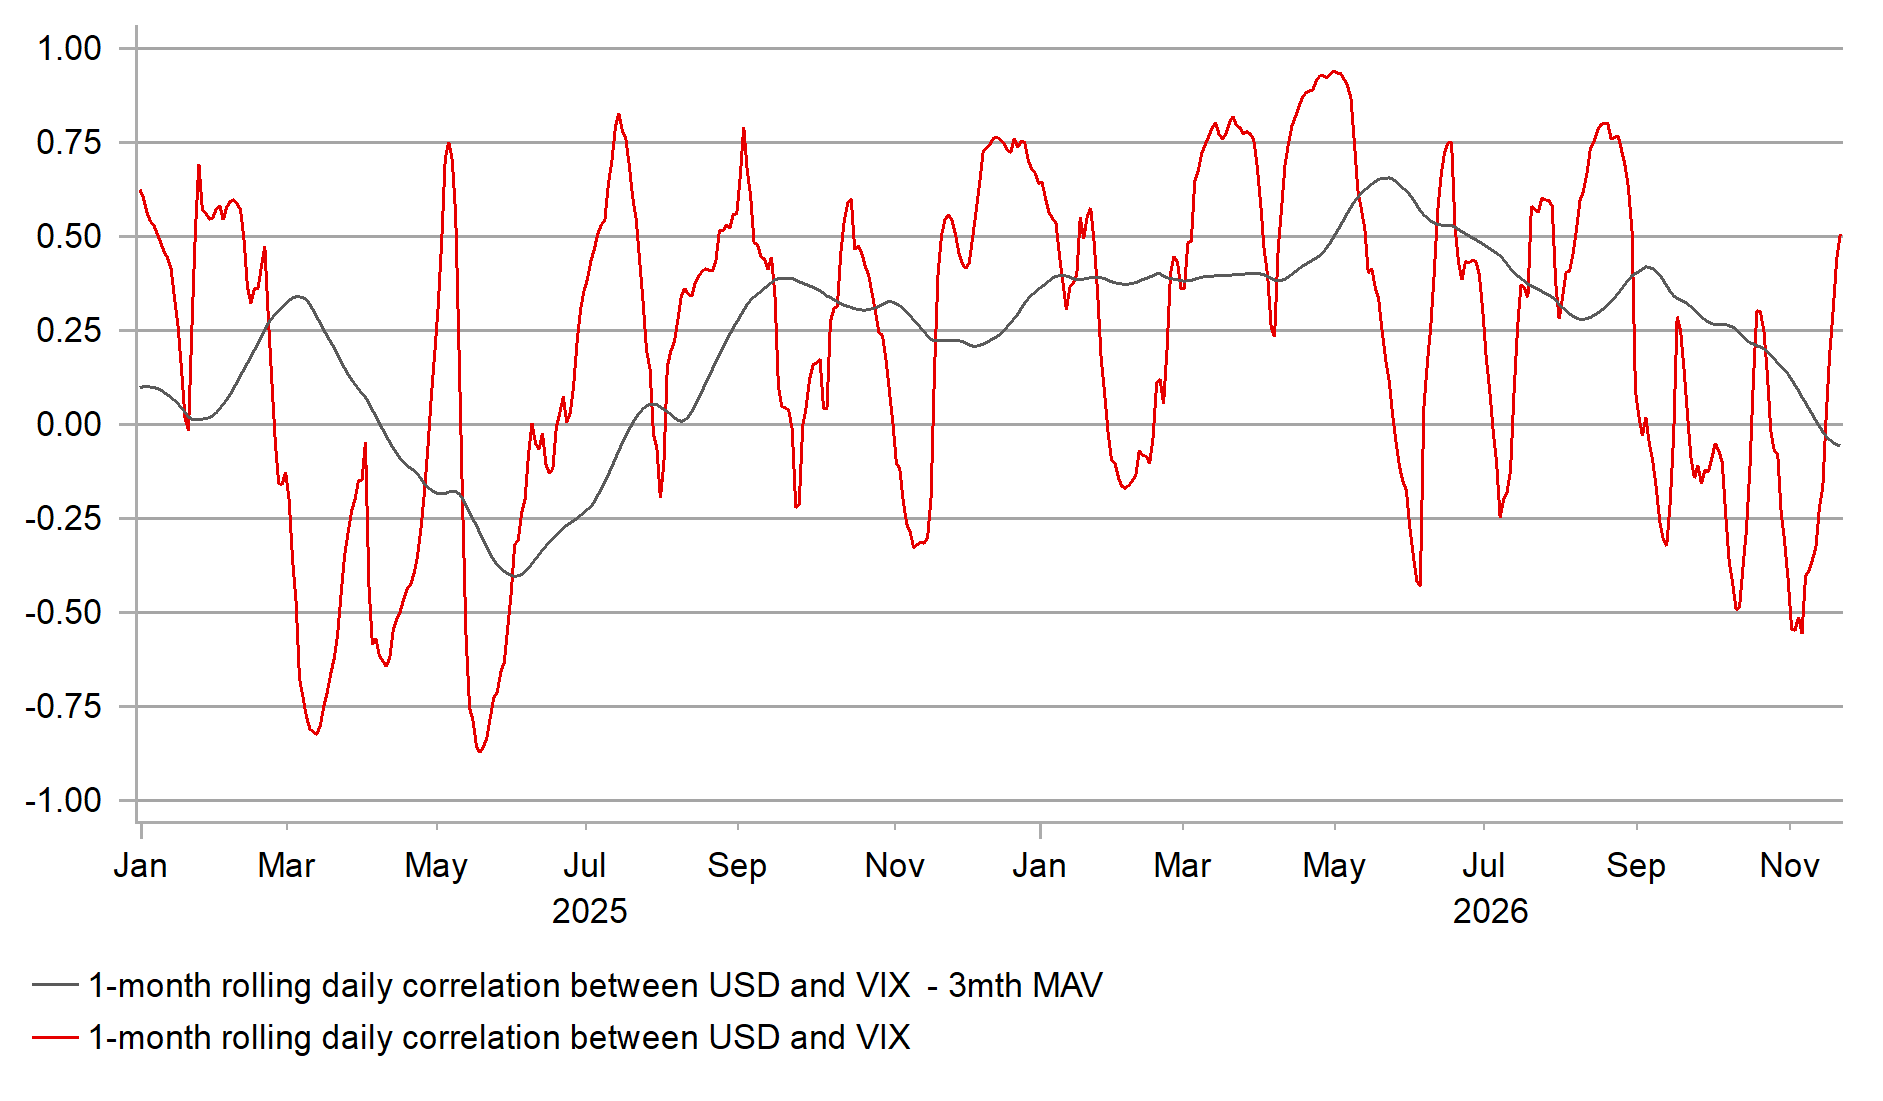
Source: Bloomberg, Macrobond & MUFG GMR
Commodity FX: Spillovers for FX market from reversal in commodity prices
The worst-performing G10 currencies over the past week have been the commodity-related NOK (-1.8% vs. USD) and AUD (-1.5%). However, not all G10 commodity currencies have sold off as sharply, with the CAD (-0.3%) and NZD (-0.4%) holding up better. At the other end of the spectrum, EM commodity currencies have been hit even harder, with the BRL (-4.7%), COP (-3.0%) and ZAR (-3.0%) all recording outsized sell-offs this week. This week’s price action extends the bearish trend for commodity currencies that has been in place throughout this month.
The sell-off in commodity currencies is being driven primarily by the deepening correction in commodity prices. After peaking in mid-September, Bloomberg’s Commodity Price Index has since fallen sharply by around 14%, breaking below support at its 200-day moving average for the first time since the summer of last year, when the recent upswing in commodity prices began. The index peaked at just above the 140 level, similar to the peak reached during the previous upswing in commodity prices between 2020 and 2022. On that occasion, commodity prices subsequently lost around a third of their value over the following two years, compared with the roughly 14% correction so far this time. This suggests there is still scope for commodity currencies to correct further in the year ahead if commodity prices continue to fall. Looking more closely at FX performance since commodity prices began rising last summer, the AUD, COP, NOK and ZAR have been among the best performers and are therefore more exposed to downside risks as commodity prices reverse course.
The correction in commodity prices in recent months has coincided with a significant hawkish repricing of Fed rate-hike expectations. Bloomberg’s Commodity Price Index peaked in mid-September, around the same time that US real yields started to move sharply higher ahead of the Fed’s decision to raise rates for the first time in response to the energy price shock. The 2-year US TIPS real yield has risen by around 70bps to 2.6% since mid-September, moving closer to its cyclical peak of just below 3.2% recorded in October 2023. Market participants have moved to price in a faster pace of Fed rate hikes this month, even as falling commodity prices have helped to lower market-based measures of inflation expectations. Recent hawkish Fed rhetoric has encouraged the US rates market to price in back-to-back hikes in December and January and/or March. This has reinforced the Fed’s inflation-fighting credibility, helping to put further downward pressure on market-based measures of inflation expectations.
REVERSAL OF COMMODITY CURRENCY STRENGTH
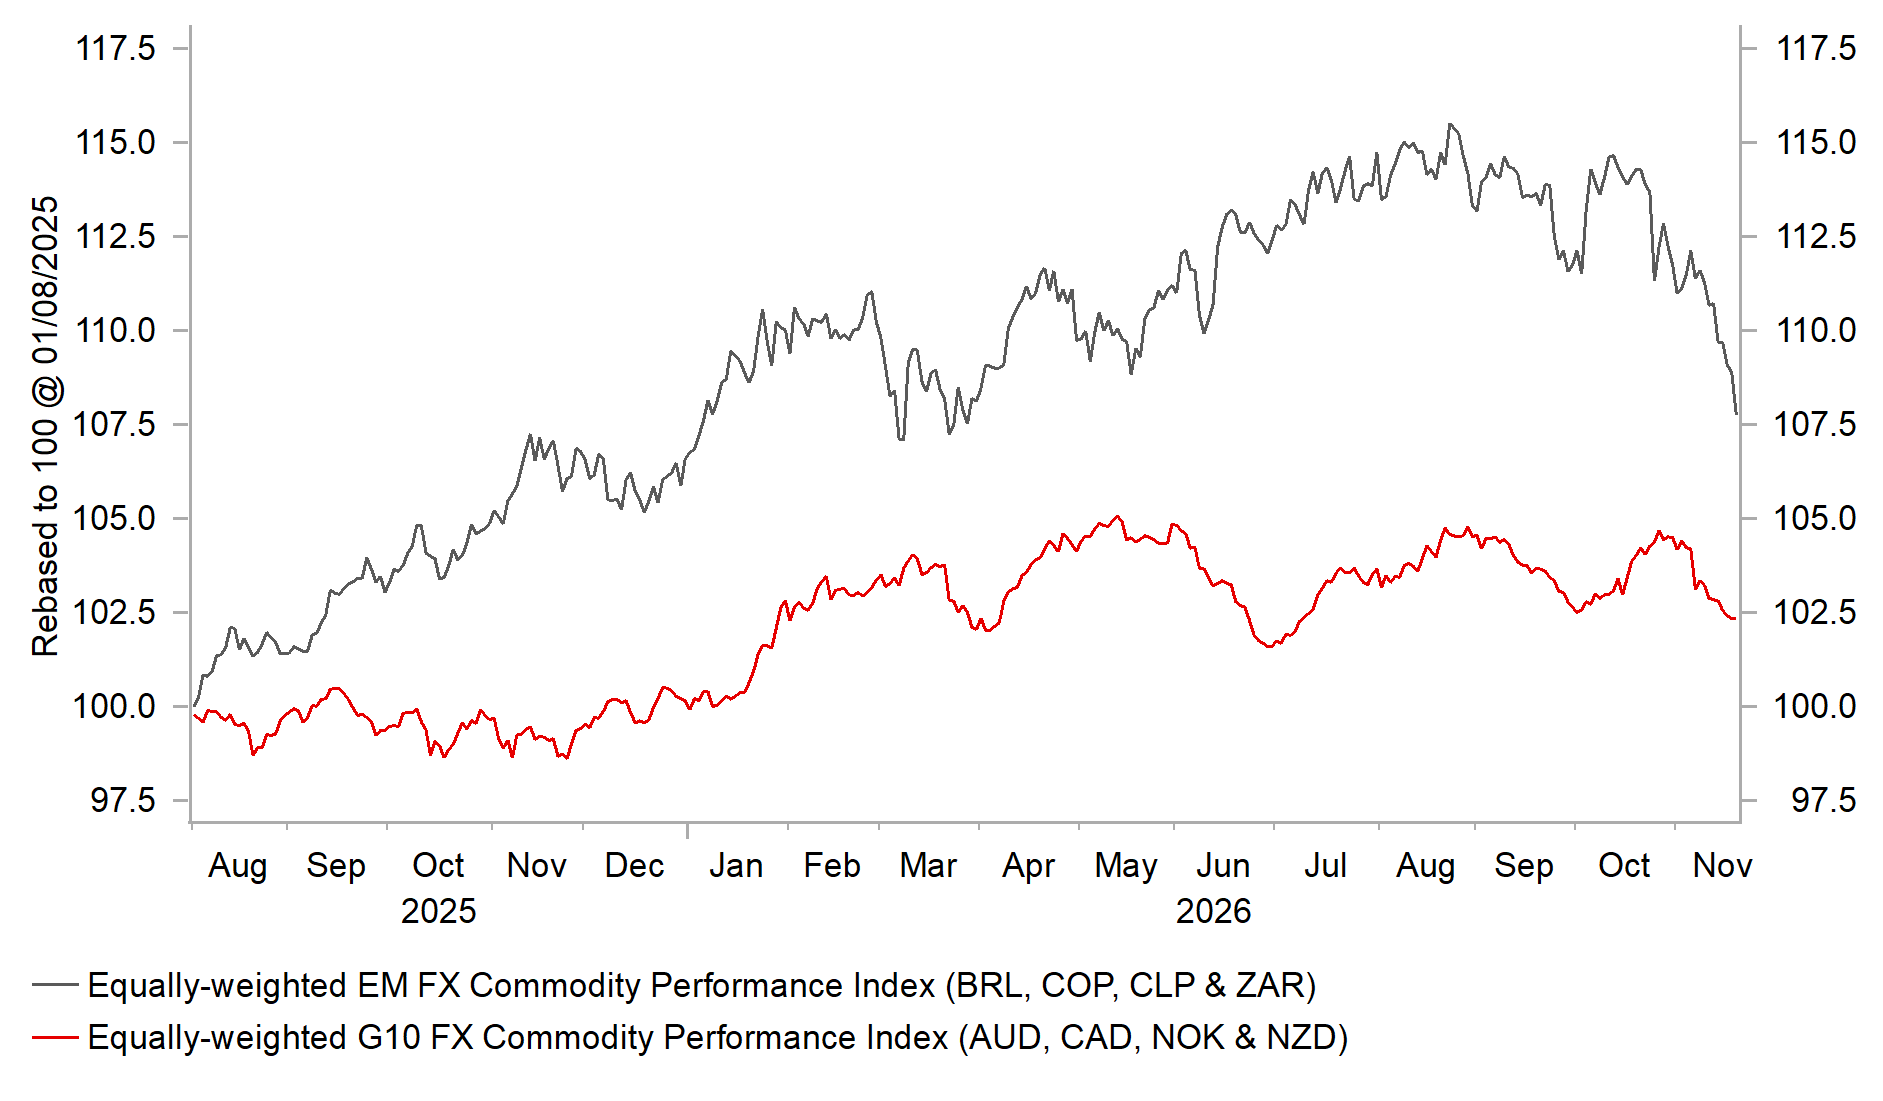
Source: Bloomberg, Macrobond & MUFG GMR
MOST AT RISK OF FURTHER REVERSAL LOWER
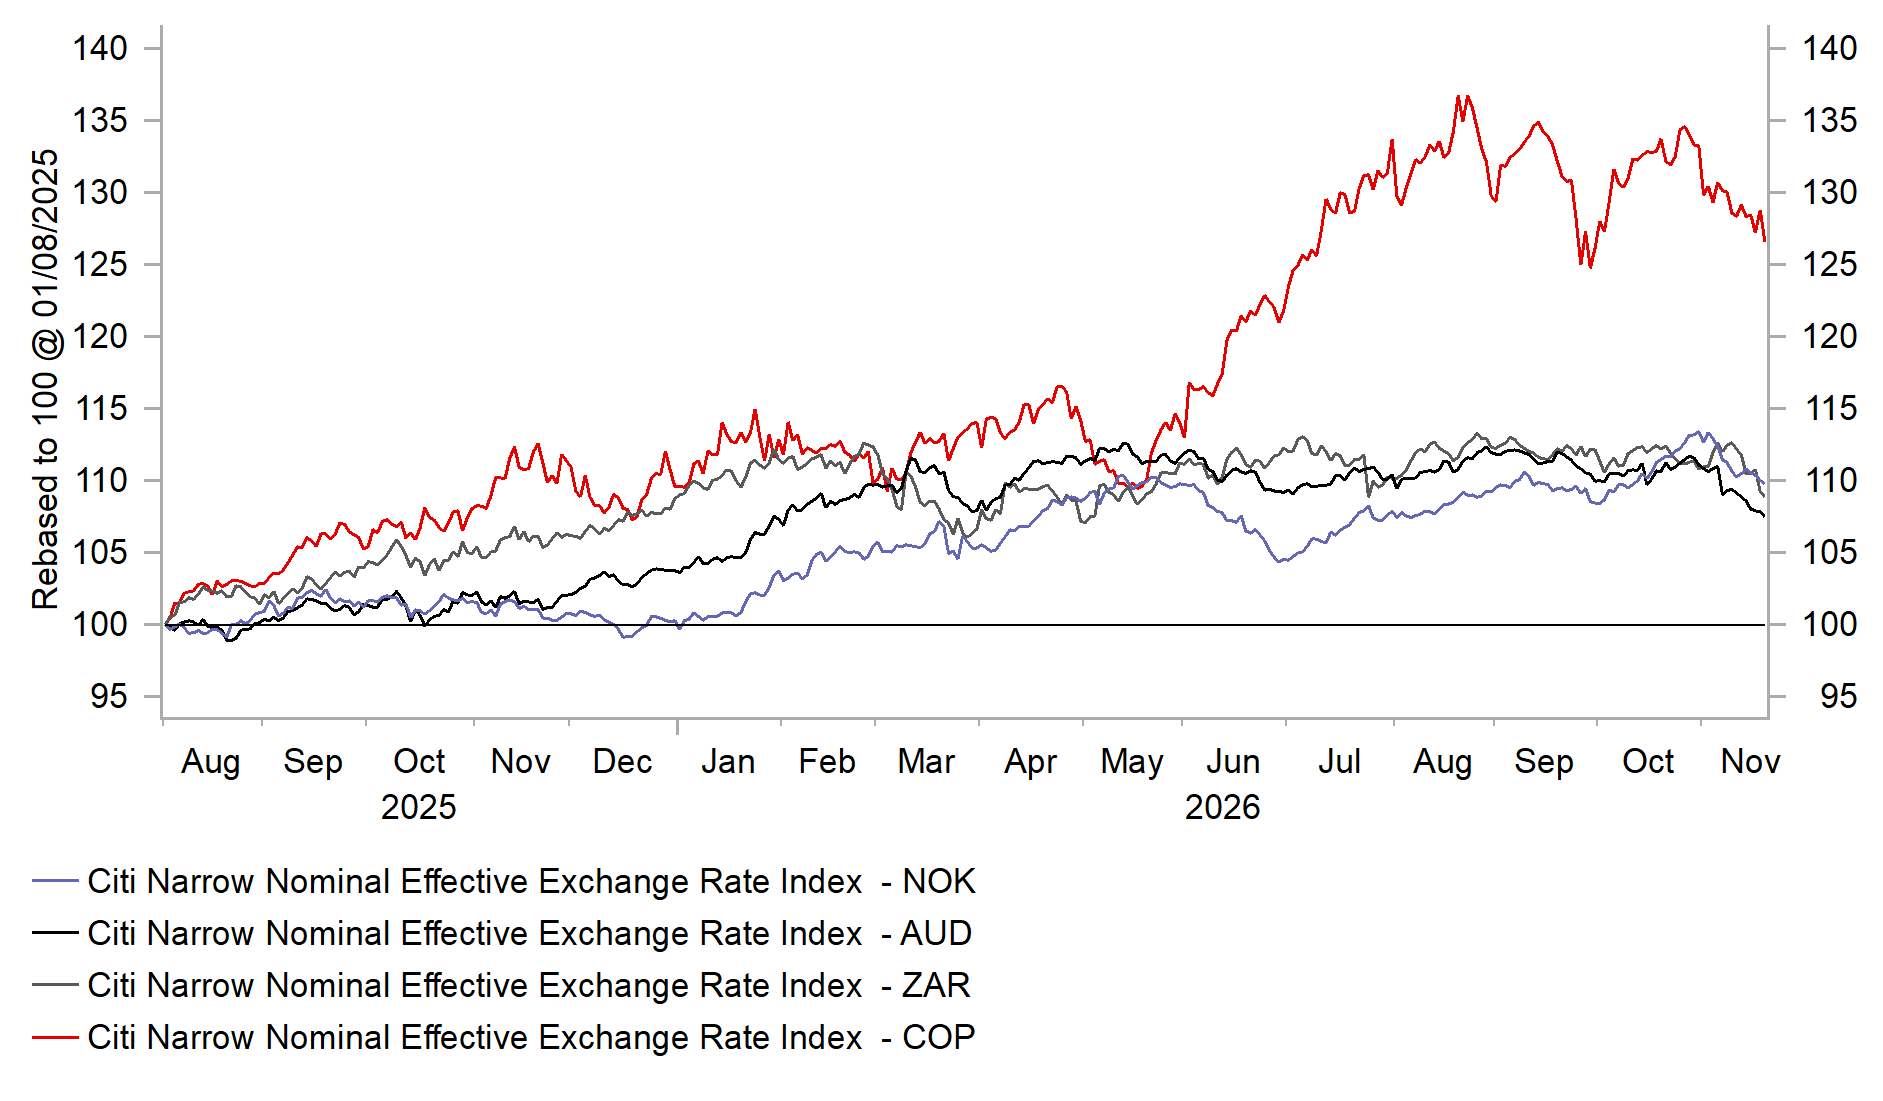
Source: Bloomberg, Macrobond & MUFG GMR
It marks a reversal from earlier this year, when the Fed’s inflation-fighting credibility was being questioned ahead of President Trump’s decision to nominate Kevin Warsh as the new Fed Chair in March. The popularity of USD debasement trades peaked just before the US-Iran conflict triggered another energy price shock, which has since encouraged a stronger USD. Precious metals were viewed as key bellwethers of the popularity of the USD debasement trade, with gold and silver prices surging by around 70% and 230%, respectively, between August 2025 and January 2026 to record highs. Those bull runs have now almost completely reversed, with gold and silver falling back towards USD3,500/ounce and USD40/ounce, respectively. This highlights how precious metals have led the broader reversal in commodity prices currently under way. The ZAR has had the strongest correlation with the gold price and has come under more intense selling pressure over the past couple of weeks. USD/ZAR has consequently risen back to levels last seen in August 2025, just above 17.500, mirroring the reversal in gold.
The correlation between gold prices and US real yields has clearly strengthened this year. USD debasement trades have unwound as threats to the Fed’s monetary policy independence have eased. Kevin Warsh has so far proved more hawkish than expected since taking over at the Fed, while the Democrats’ victory in the US midterm elections and their control of Congress have further reduced concerns over Fed independence. Together, these developments have dampened fears that monetary policy could be kept too loose to bring inflation back under control. The resulting reduction in the US policy risk premium priced into the USD has likely contributed to its recent strength, while putting greater downward pressure on commodity currencies.
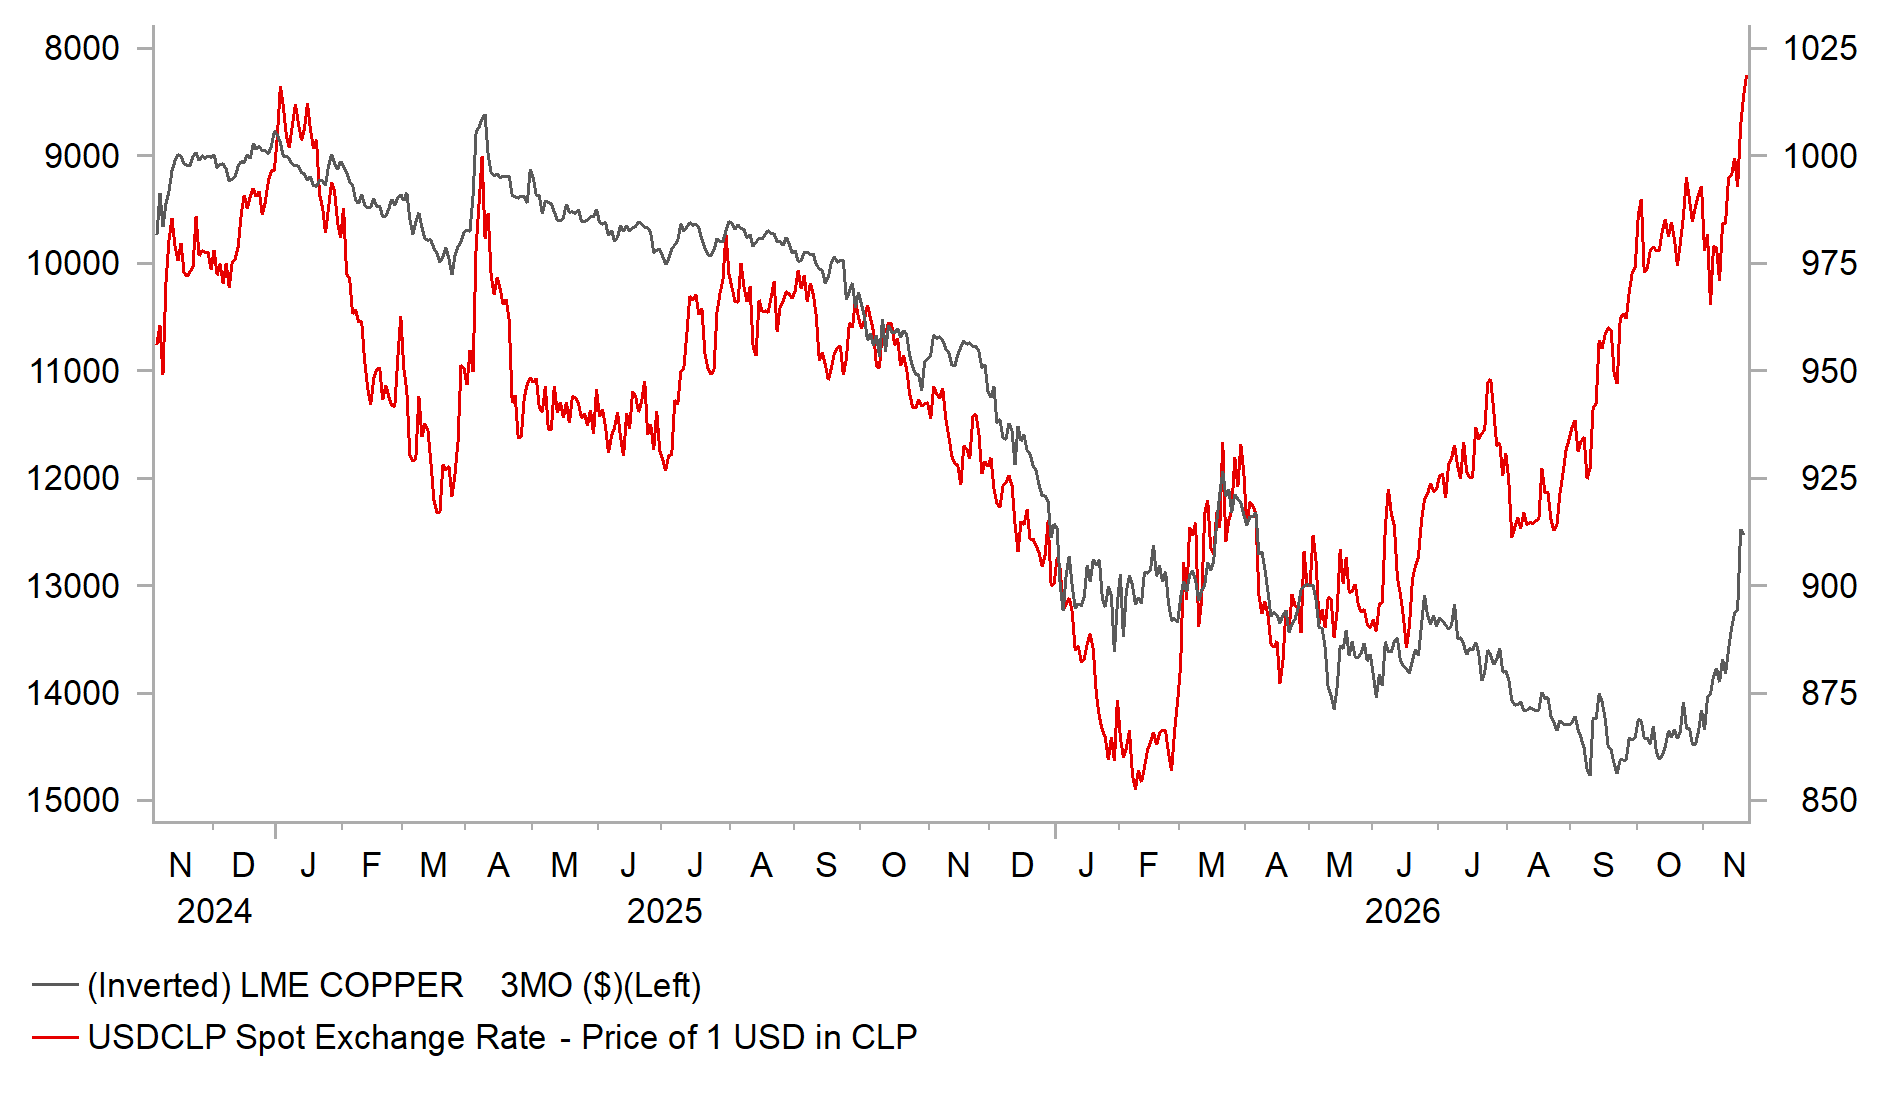
The sell-off in commodity prices is also being reinforced by waning investor confidence in AI-related investment. The build-out of AI infrastructure has helped boost commodity demand and supported resilient global growth this year, despite headwinds from the energy price shock. However, market participants are beginning to question the sustainability of strong AI-related demand, while the US midterm election results have added to uncertainty over the continued build-out of data centres in the US. The price of copper has become much more closely correlated with the performance of US tech stocks this year and has fallen sharply in recent days, declining by around 7.5% and extending its correction from the September peak to almost 20%. This is adding to downside risks for the AUD and CLP. However, the correlation between copper prices and USD/CLP has weakened this year. This weaker relationship may reflect the failure of higher copper prices to translate into stronger copper production and economic growth in Chile. Supply disruptions have instead resulted in a contraction in copper production and a sharp slowdown in economic growth.
ZAR HIT AS SHINE COMES OFF PRECIOUS METALS
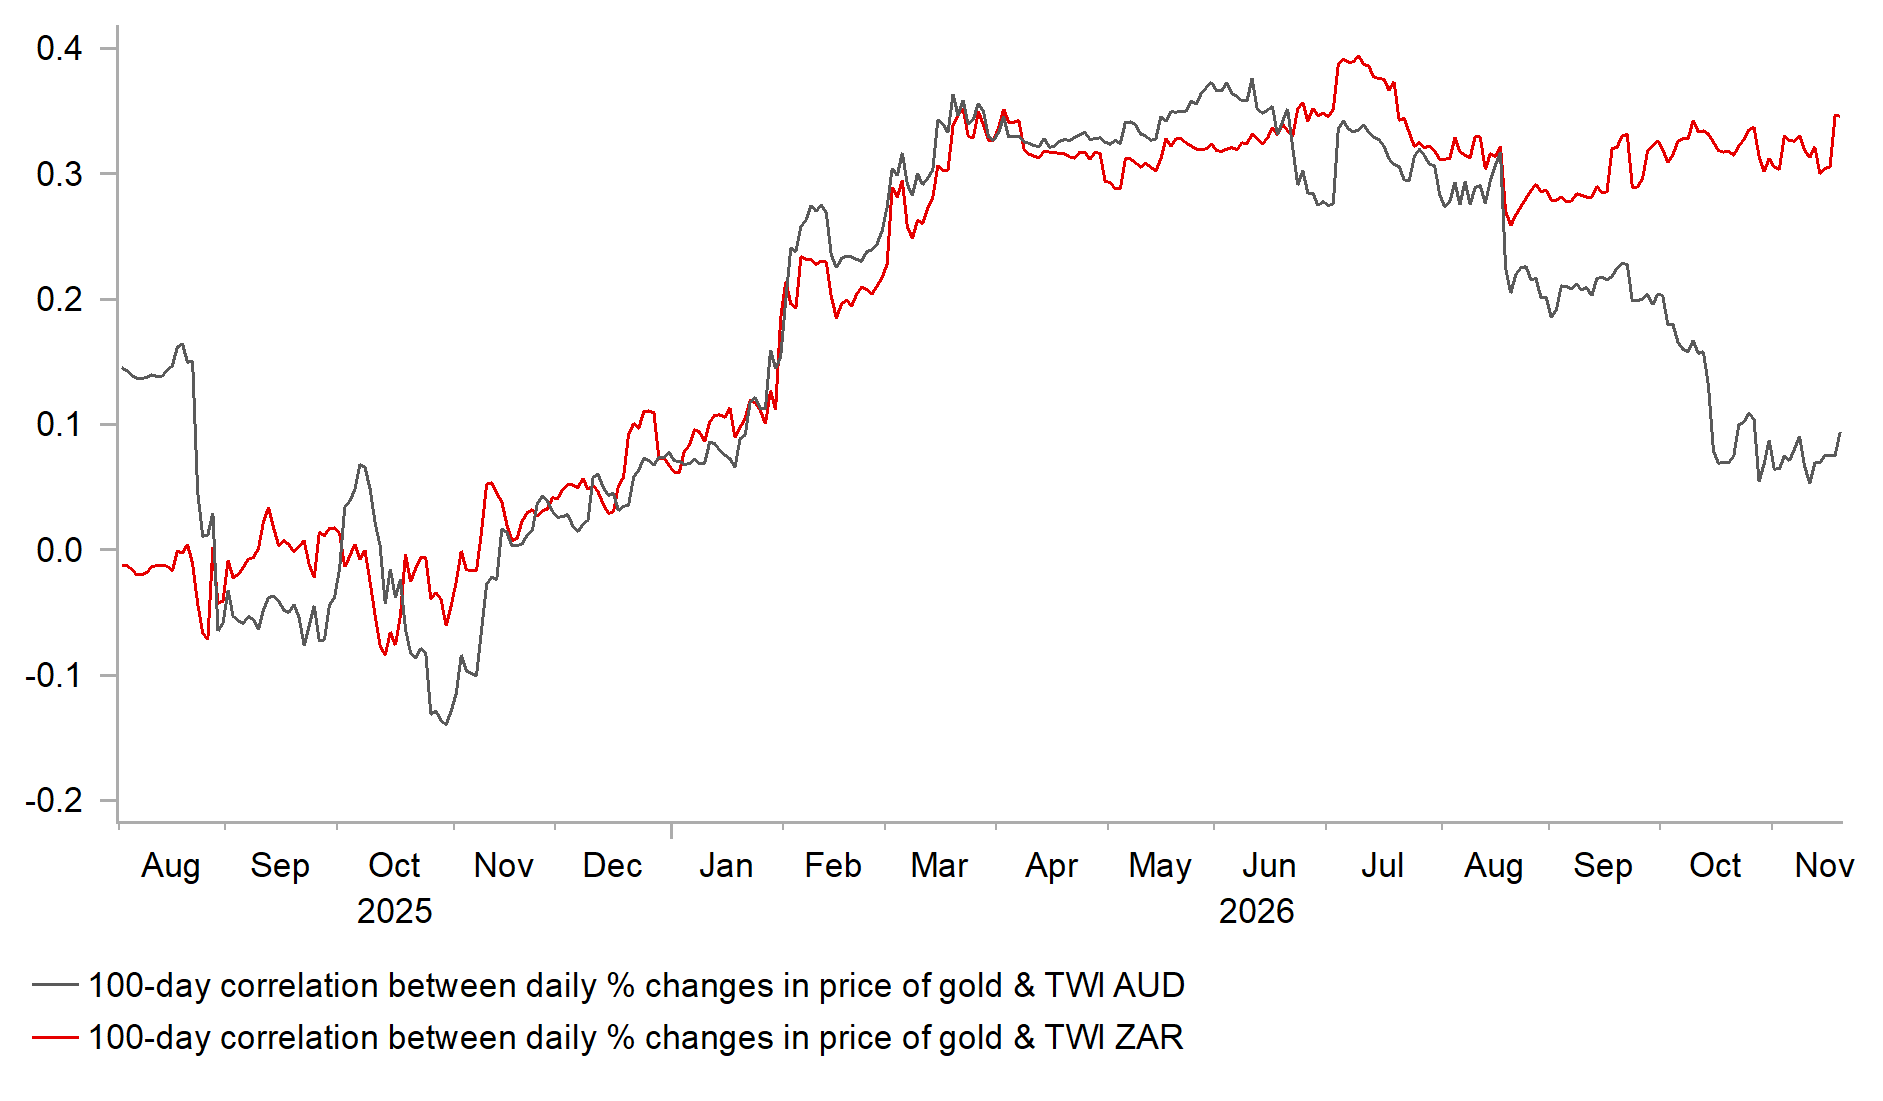
Source: Bloomberg, Macrobond & MUFG GMR
WEAKER RELATIONSHIP BETWEEN CLP & COPPER
Source: Bloomberg, Macrobond & MUFG GMR
Weekly Calendar
Ccy | Date | GMT | Indicator/Event | Period | Consensus | Previous | Mkt Moving |
EUR | 23/11/2026 | 09:00 | S&P Global Eurozone Manufacturing PMI | Nov P | -- | 52.7 | !!! |
EUR | 23/11/2026 | 09:00 | S&P Global Eurozone Services PMI | Nov P | -- | 51.4 | !!! |
GBP | 23/11/2026 | 09:30 | S&P Global UK Services PMI | Nov P | -- | 52.8 | !!! |
GBP | 23/11/2026 | 09:30 | S&P Global UK Manufacturing PMI | Nov P | -- | 52.8 | !!! |
EUR | 23/11/2026 | 13:00 | ECB's Simkus, BOE's Pill Speak | !! | |||
USD | 23/11/2026 | 14:45 | S&P Global US Manufacturing PMI | Nov P | -- | 54.9 | !! |
USD | 23/11/2026 | 14:45 | S&P Global US Services PMI | Nov P | -- | 56.1 | !! |
USD | 23/11/2026 | 21:00 | Fed's Williams Delivers Keynote Address | !!! | |||
EUR | 24/11/2026 | 09:00 | Germany IFO Business Climate | Nov | -- | 90.2 | !! |
USD | 24/11/2026 | 15:00 | Conf. Board Consumer Confidence | Nov | 92.1 | 91.7 | !! |
CAD | 24/11/2026 | 16:30 | BoC Governor Tiff Macklem Speaks | !!! | |||
USD | 24/11/2026 | 17:00 | Annual Revision to Industrial Production | !! | |||
AUD | 25/11/2026 | 00:30 | CPI YoY | Oct | -- | 4.3% | !!! |
EUR | 25/11/2026 | 07:00 | Germany GDP SA QoQ | 3Q F | -- | 0.2% | !! |
USD | 25/11/2026 | 13:30 | Personal Spending | Oct | 0.4% | 0.5% | !! |
USD | 25/11/2026 | 13:30 | Core PCE Price Index MoM | Oct | 0.3% | 0.3% | !!! |
USD | 25/11/2026 | 13:30 | GDP Annualized QoQ | 3Q S | 3.4% | 3.4% | !! |
USD | 25/11/2026 | 13:30 | Initial Jobless Claims | -- | -- | !! | |
USD | 25/11/2026 | 13:30 | Durable Goods Orders | Oct P | 0.6% | 1.9% | !! |
USD | 25/11/2026 | 19:00 | Fed Releases Beige Book | !! | |||
NOK | 26/11/2026 | 07:00 | GDP Mainland QoQ | 3Q | -- | 0.3% | !! |
EUR | 26/11/2026 | 12:30 | ECB Publishes Account of Oct. Meeting | !! | |||
JPY | 26/11/2026 | 23:30 | Tokyo CPI YoY | Nov | 3.1% | 2.8% | !! |
SEK | 27/11/2026 | 07:00 | GDP QoQ | 3Q | -- | 1.6% | !! |
EUR | 27/11/2026 | 08:55 | Germany Unemployment Change (000's) | Nov | -- | 4.0k | !! |
USD | 27/11/2026 | 13:30 | Advance Goods Trade Balance | Oct | -$131.7b | -$135.1b | !! |
Source: Bloomberg & MUFG GMR
Key Events:
There is a lighter calendar of economic data and events in the week ahead, leaving the focus on the outlook for Fed policy following the recent hawkish repricing. The main data release will be the US PCE deflator report for October, which will provide an important update on underlying inflation pressures ahead of the December FOMC meeting. Core PCE inflation is expected to increase by 0.3% M/M for a third consecutive month. If confirmed, the annualized rate would rise to 3.6% over the past three months and 3.0% over the past six months. The lack of progress towards the Fed’s 2.0% inflation goal, alongside stronger economic and employment growth, is increasing pressure on the Fed to move rates further into restrictive territory. New York Fed President Williams is the only Fed official currently scheduled to speak. This week, he pushed back against expectations for a larger 50bp hike, saying that “I don’t think the situation calls for dramatic action”. However, he acknowledged that the economy is strengthening and inflation remains stubbornly high, reinforcing the message that the Fed still has “work to do”.
The main focus at the start of next week will be the release of the November PMI surveys for Europe and the US. The euro-area composite PMI dropped sharply in October from September’s year-to-date high of 53.1, driven in part by a more pronounced deterioration in French business confidence. France’s economy unexpectedly contracted in Q3, while the sharp rise in borrowing costs amid heightened fiscal and political risks has created a more challenging growth backdrop heading into year-end. In contrast, business confidence in the UK continues to improve, signaling that stronger growth is likely to persist in Q4. The November PMI surveys will provide an important test of whether the recent cyclical divergence between the euro-area and UK economies is being sustained.
The release of the latest Australian CPI report for October could have a bigger-than-usual market impact. The Australian rates market has become more confident that the current hiking cycle is over. It has gone further by pricing in more than a 50:50 chance of a rate cut by the middle of next year. The dovish repricing followed the much weaker-than-expected labour market report for October, which revealed a more marked loosening in labour market conditions. However, the CPI report could still show that near-term inflation risks remain tilted to the upside.