Please download PDF from above for the following currencies.
Australian dollar // New Zealand dollar //Canadian dollar // Norwegian krone // Swedish Krona // Swiss franc // Czech koruna // Hungarian forint //Polish zloty // Romanian leu // Russian rouble // South African rand // Turkish lira // Indian rupee // Indonesian rupiah // Malaysian ringgit // Philippine peso //Singapore dollar // South Korean won // Taiwan dollar // Thai baht // Vietnamese dong // Argentine peso // Brazilian real // Chilean peso // Mexican peso // Crude oil // Saudi riyal // Egyptian pound
Monthly Foreign Exchange Outlook
DEREK HALPENNY
Head of Research, Global Markets EMEA and International Securities
Global Markets Research
Global Markets Division for EMEA
E: derek.halpenny@uk.mufg.jp
LEE HARDMAN
Senior Currency Analyst
Global Markets Research
Global Markets Division for EMEA
E: lee.hardman@uk.mufg.jp
LIN LI
Head of Global Markets Research Asia
Global Markets Research
Global Markets Division for Asia
E: lin_li@hk.mufg.jp
KHANG SEK LEE
Associate
Global Markets Research
Global Markets Division for Asia
E: khangsek_lee@hk.mufg.jp
MICHAEL WAN
Senior Currency Analyst
Global Markets Research
Global Markets Division for Asia
E: michael_wan@sg.mufg.jp
LLOYD CHAN
Senior Currency Analyst
Global Markets Research
Global Markets Division for Asia
E: lloyd_chan@sg.mufg.jp
EHSAN KHOMAN
Head of Commodities, ESG and Emerging Markets Research – EMEA
DIFC Branch – Dubai
E: ehsan.khoman@ae.mufg.jp
SOOJIN KIM
Analyst, ESG and Emerging Markets Research – EMEA
DIFC Branch – Dubai
E: soojin.kim@ae.mufg.jp
MUFG Bank, Ltd.
A member of MUFG, a global financial group
April 2025
KEY EVENTS IN THE MONTH AHEAD
1) RECIPROCAL TARIFFS ARE IMMINENT
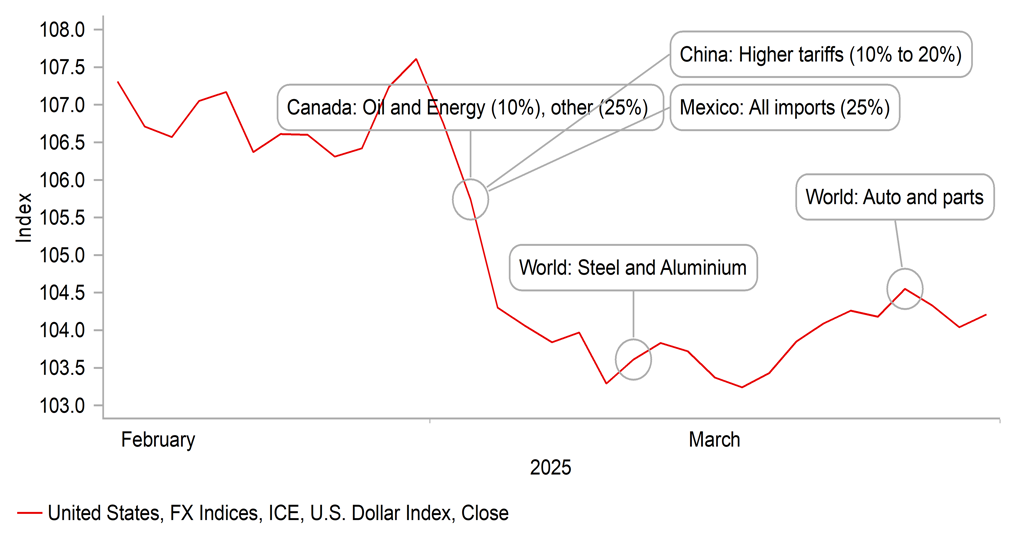
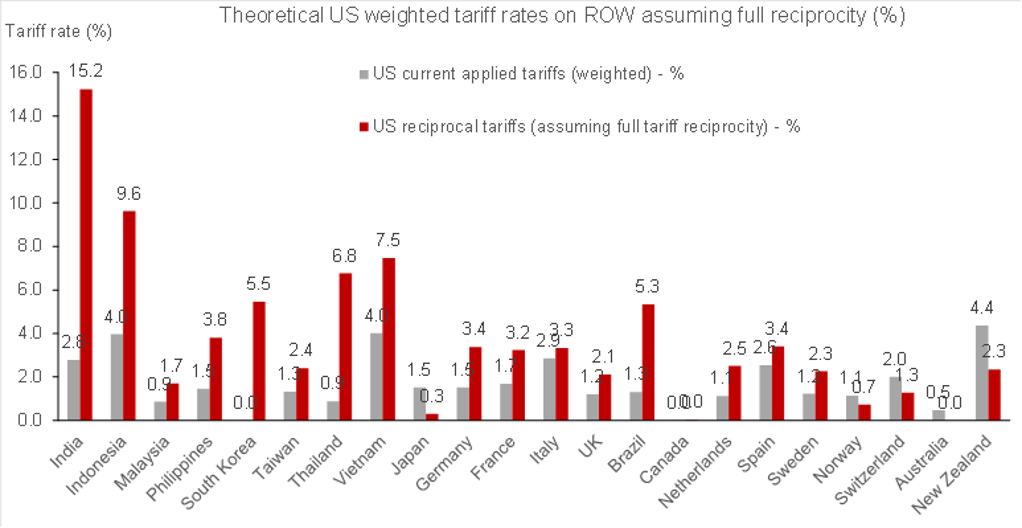
The most obvious event in the month ahead is of course the announcement of the US reciprocal tariff plan on what President Trump is calling “Liberation Day” on the 2nd April. We had considered delaying this publication to await the announcement but in reality there is a high chance that we may not immediately have clarity and it may be days until we fully understand the plans, and whether there may be negotiations and carve-outs that alter the framework of the plan. A report in the Wall Street Journal prompted some renewed risk aversion at the end of March as it suggested aggressive and broad-based tariff action – possibly at a level of 20% against all countries. Trump also stated on 30th March that “essentially all” US trading partners would be targeted. Another possibility is targeting countries with bigger trade deficits. This would still hit many of the key economies like Canada, Mexico, the EU, China and many other Asian countries. We suspect there is a lack of conviction and investors to some degree view tariff speculation as “untradeable” and are awaiting clarity before taking risk. This could mean we see some big moves after the announcements. We certainly see scope for investors shifting focus back to global growth concerns that could see rates drop relative to the US and prompt some US dollar recovery. The Fed could be constrained for longer than expected in order to allow time to assess the inflation impact of tariffs. Following the global inflation shock, increased caution by the Fed would not be a surprise. We still would expect to see that caution give way in H2 as growth fears take precedence which would then open up scope for a more sustained weakening of the US dollar.
2) SMALL NUMBER OF CENTRAL BANKS MEET
Four G10 central banks will meet in April – the RBA on 1st April; the RBNZ on 9th April; the BoC on 16th April; and the ECB on 17th April. The RBNZ is nearly fully priced for a 25bp cut while for the ECB the implied probability for a 25bp cut is around 75%. The BoC has about 8bps of easing priced but of course that could change more notably following the reciprocal tariff plan on 2nd April. The RBA did not change its monetary stance at its meeting at the start of April. In general, we do see OIS pricing for rate cuts in general as implying an under-estimate of the potential economic impact of tariff action and the willingness of central banks to respond.
2) TARIFFS UNCERTAINTIES REMAIN, NEGOTIATION STILL POSSIBLE
The Chinese government announced policy measures to boost consumption against the headwinds coming from already implemented US tariffs and the potential for further that could still hit on or after 2nd April. That said, a potential negotiation between China and US cannot be ruled out which would help mitigate the downside risk to growth as well. Positively, March’s official PMI readings and the January-February macro data shows government policies are working, and would help to offset the drag from tariffs to some extent.
Forecast rates against the US dollar - End-Q2 2025 to End-Q1 2026
|
Spot close 31.03.25 |
Q2 2025 |
Q3 2025 |
Q4 2025 |
Q1 2026 |
|
|
JPY |
149.69 |
152.00 |
150.00 |
148.00 |
146.00 |
|
EUR |
1.0811 |
1.0600 |
1.0800 |
1.1000 |
1.1400 |
|
GBP |
1.2919 |
1.2850 |
1.2930 |
1.3170 |
1.3570 |
|
CNY |
7.2564 |
7.4000 |
7.4000 |
7.3500 |
7.3000 |
|
AUD |
0.6237 |
0.6100 |
0.6300 |
0.6500 |
0.6600 |
|
NZD |
0.5669 |
0.5600 |
0.5700 |
0.5800 |
0.6000 |
|
CAD |
1.4374 |
1.4800 |
1.4700 |
1.4200 |
1.3800 |
|
NOK |
10.517 |
10.943 |
10.648 |
10.364 |
9.8250 |
|
SEK |
10.034 |
10.472 |
10.370 |
10.000 |
9.4740 |
|
CHF |
0.8837 |
0.8870 |
0.8610 |
0.8450 |
0.8330 |
|
|
|
|
|
|
|
|
CZK |
23.080 |
23.580 |
23.150 |
22.550 |
21.670 |
|
HUF |
372.13 |
382.10 |
379.60 |
377.30 |
364.00 |
|
PLN |
3.8725 |
3.9620 |
3.8890 |
3.8640 |
3.7280 |
|
RON |
4.6023 |
4.6980 |
4.6200 |
4.5550 |
4.4120 |
|
RUB |
83.893 |
87.630 |
88.800 |
89.950 |
89.370 |
|
ZAR |
18.371 |
18.500 |
18.750 |
19.000 |
18.750 |
|
TRY |
37.932 |
39.500 |
41.500 |
44.000 |
46.000 |
|
|
|
|
|
|
|
|
INR |
85.460 |
86.800 |
87.200 |
87.500 |
87.000 |
|
IDR |
16575 |
16625 |
16410 |
16200 |
16300 |
|
MYR |
4.4330 |
4.5500 |
4.4500 |
4.4000 |
4.3500 |
|
PHP |
57.240 |
58.800 |
58.500 |
58.200 |
58.000 |
|
SGD |
1.3435 |
1.3750 |
1.3700 |
1.3650 |
1.3500 |
|
KRW |
1472.9 |
1480.0 |
1475.0 |
1460.0 |
1445.0 |
|
TWD |
33.183 |
33.500 |
33.400 |
33.100 |
32.800 |
|
THB |
33.941 |
35.400 |
35.700 |
35.500 |
35.000 |
|
VND |
25544 |
25900 |
25900 |
25900 |
25800 |
|
|
|
|
|
|
|
|
ARS |
1073.0 |
1225.0 |
1400.0 |
1500.0 |
1600.0 |
|
BRL |
5.7318 |
5.8500 |
5.9000 |
6.0000 |
6.0500 |
|
CLP |
951.47 |
965.00 |
980.00 |
990.00 |
1000.0 |
|
MXN |
20.437 |
20.750 |
21.000 |
20.750 |
20.500 |
|
|
|||||
|
Brent |
74.63 |
74.00 |
77.00 |
75.00 |
78.00 |
|
NYMEX |
71.19 |
69.00 |
73.00 |
70.00 |
73.00 |
|
SAR |
3.7510 |
3.7500 |
3.7500 |
3.7500 |
3.7500 |
|
EGP |
50.539 |
50.800 |
51.000 |
51.200 |
51.400 |
Notes: All FX rates are expressed as units of currency per US dollar bar EUR, GBP, AUD and NZD which are expressed as dollars per unit of currency. Data source spot close; Bloomberg closing rate as of 4:30pm London time, except VND which is local onshore closing rate.
US dollar
|
Spot close 31.03.25 |
Q2 2025 |
Q3 2025 |
Q4 2025 |
Q1 2026 |
|
|
USD/JPY |
149.69 |
152.00 |
150.00 |
148.00 |
146.00 |
|
EUR/USD |
1.0811 |
1.0600 |
1.0800 |
1.1000 |
1.1400 |
|
Range |
Range |
Range |
Range |
||
|
USD/JPY |
143.00-158.00 |
141.00-156.00 |
139.00-154.00 |
137.00-152.00 |
|
|
EUR/USD |
1.0400-1.1100 |
1.0500-1.1300 |
1.0700-1.1500 |
1.0900-1.1800 |
MARKET UPDATE
In March the US dollar weakened notably against the euro in terms of London closing rates, from 1.0400 to 1.0811. In addition, the dollar weakened against the yen, from 150.27 to 149.69. The FOMC at its meeting in March kept the range for the federal funds rate unchanged at 4.25% to 4.50%, following 100bps of cuts last year. The FOMC did make a change to its policy of reducing its securities holdings with the pace of QT cut with the cap of UST bonds allowed to roll off the balance sheet reduced from USD 25bn per month to just USD 5bn. The pace of reduction in the holdings of MBS has been running at around USD 15bn per month.
OUTLOOK
We are sceptical that there will be a linear, straight-line depreciation of the US dollar and see aggressive, broad-based tariff action on 2nd April re-igniting fears over global growth relative to the US. While Trump’s tariff plans are not good for the US economy, the hit will be even greater to the US’s key trading partners. Pricing for further central bank easing does not appear to us to capture the economic risks that may lie ahead if Trump follows through with an aggressive reciprocal tariff plan. It is difficult to predict the details but a Wall Street Journal article citing reliable sources pointed to high tariff rates across all countries along with the potential for secondary tariffs on countries purchasing crude oil from Russia similar to the plan already announced on Venezuela oil. The plan could also focus on countries with the largest trade deficits suggesting a bigger hit for countries like the EU, China, Canada, Mexico, Vietnam and other Asian countries. We see scope for the US dollar to rebound by 2-3% by the end of Q2 (scope for more prior to end-Q2) as the focus shifts back to the damage done on economies outside of the US.
The inflation threat if the reciprocal tariff plan is widespread will increase upside risks in the US and make the Federal Reserve more cautious of cutting rates until the impact can be assessed over the coming months. That could create some uncertainty over the scope for cutting rates at the June meeting, which is now nearly fully priced. Nonetheless, beyond this period of uncertainty we would expect the FOMC to then have greater confidence on cutting rates given the labour market will begin to weaken and the FOMC will then see greater prospects of the tariff inflation impact as being a one-off price adjustment. This will open up the Fed to being more active in cutting rates in H2. Hence, we see renewed US dollar depreciation unfolding later in the year. The impact of DOGE and government spending cuts will likely also be more evident by then with Federal workers’ contracts terminating which is likely to result in the employment data deteriorating.
In these circumstances, we see scope for the US dollar to recover somewhat as investors shift their focus to the hit to the economies of trading partners of the US. Beyond Q2 however, the Fed will likely be more confident on the capacity for cutting rates leading to the dollar weakening in the second half of the year.
INTEREST RATE OUTLOOK
|
Interest Rate Close |
Q2 2025 |
Q3 2025 |
Q4 2025 |
Q1 2026 |
|
|
Policy Rate |
4.33% |
4.13% |
4.13% |
3.88% |
3.63% |
|
3-Month T-Bill |
4.29% |
4.00% |
4.00% |
3.75% |
3.50% |
|
10-Year Yield |
4.21% |
4.25% |
4.38% |
4.25% |
4.13% |
* Interest rate assumptions incorporated into MUFG foreign exchange forecasts.
The FOMC met on 18th March when they held rates steady while reducing the UST QT pace from USD25bn to USD5bn starting in April. The summary of economic projections (SEP) came in as expected and the Fed Funds median terminal rates were kept constant. However, the economic projections were notable as there were significant changes in the Fed’s expectations for 2025 with a decline in real GDP by 0.4% and hotter inflation expectations with PCE and Core PCE ticking up 0.2% and 0.3% respectively. These changes to growth was in response to new immigration policies, austerity measures, and trade policy outweighing potential upside risks of deregulation. In our view, unless the economy materially weakens along with risk markets, given the stagflation risks, we believe that there should be a max of only 2-3 cuts for 2025 and we maintain our view that the Fed will deliver 2 cuts in 2025 (In June and December). Further afield we see a range of possibilities that could result in the Fed moving rates lower towards or through neutral in 2026. Conversely, if we avoid a downturn, risks of a longer hold also remain. You can find more insights about our FOMC recap report from this link.
(George Goncalves)
DXY PERFORMANCE VS. TARIFF ANNOUNCEMENTS
Source: Bloomberg, Macrobond
THEORETICAL WEIGHTED TARIFFS
Source: Bloomberg, Macrobond
Japanese yen
|
Spot close 31.03.25 |
Q2 2025 |
Q3 2025 |
Q4 2025 |
Q1 2026 |
|
|
USD/JPY |
149.69 |
152.00 |
150.00 |
148.00 |
146.00 |
|
EUR/JPY |
161.83 |
161.10 |
162.00 |
162.80 |
166.40 |
|
Range |
Range |
Range |
Range |
||
|
USD/JPY |
143.00-158.00 |
141.00-156.00 |
139.00-154.00 |
137.00-152.00 |
|
|
EUR/JPY |
155.00-167.00 |
155.50-168.00 |
156.00-169.00 |
157.00-170.00 |
MARKET UPDATE
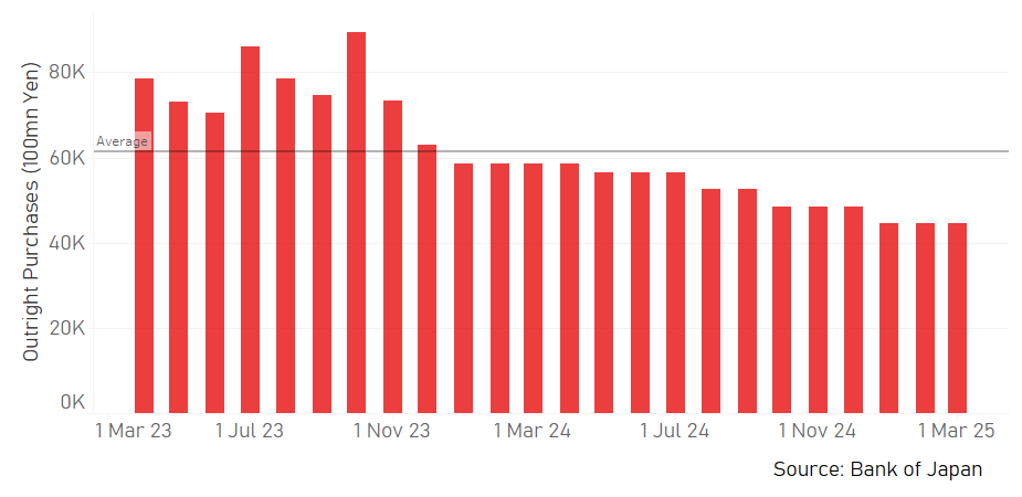
In March the yen strengthened versus the US dollar in terms of London closing rates from 150.27 to 149.69. However, the yen weakened sharply versus the euro from 156.28 to 161.83. The BoJ at its meeting in March kept the key policy rate unchanged at 0.50%, following the 25bp hike in January, the first 25bp rate hike since before the GFC in 2007. The BoJ is also continuing with the policy of cutting JGB purchases that was announced last July that will see purchases cut by JPY 400bn per quarter that will result in the BoJ’s balance sheet being reduced by 7-8% by Q1 2026.
OUTLOOK
The yen was the worst performing G10 currency in March with fiscal policy stimulus announced in Germany helping to lift yields in Europe and encouraging yen selling versus non-dollar currencies. China also announced policies to stimulate consumer spending to offset the negative impact on external demand from US trade tariffs. The increased uncertainty globally due to trade tariffs is adding to uncertainty over whether the BoJ will be in a position to continue hiking rates. The auto tariffs will also hit Japan more than most other countries with US auto imports from Japan the second largest with only Mexico larger. The summary of the BoJ meeting that took place in March revealed some increased concerns expressed over international developments that does suggest the potential risk that the BoJ may at some point alter its guidance on rate hikes and signal a pause until there is greater clarity.
However, the summary of the BoJ meeting also indicated there were voices suggesting the BoJ may have to look through the uncertainties abroad given the upside inflation risks in Japan. We believe developments in Japan will take precedence and only if we see a pronounced pick-up in financial market volatility will we see the BoJ forced into a longer pause. Firstly, the ‘shunto’ wage negotiations revealed the first estimate from Rengo of 5.46%, higher than a year ago and a strong signal of another year of solid wage growth. Secondly, Tokyo inflation data for March was much stronger than expected. The core-core annual CPI rate picked up from 1.9% to 2.2% fuelled by strong food inflation and a pick-up in rental inflation. Higher rents is likely a clear consequence of increased wage growth and is an indication of the feed-through the BoJ wants to see. Finally, the yen has returned to weaker levels that likely means there would be political pressure on the BoJ to avoid allowing further currency depreciation. The cost of living crisis remains a big political issue in Japan and avoiding further yen depreciation is quite likely a desire of the government with the Upper House elections in July.
We maintain our view of yen strength ahead. With the Fed in the US on pause, falling yields that would help strengthen the yen is not likely until later in the year. Still, yen downside risks from here seem quite limited as well and assuming the BoJ do not abandon its guidance on monetary tightening, we see yen gains ahead
INTEREST RATE OUTLOOK
|
Interest Rate Close |
Q2 2025 |
Q3 2025 |
Q4 2025 |
Q1 2026 |
|
|
Policy Rate |
0.50% |
0.50% |
0.75% |
0.75% |
1.00% |
|
3-Month Bill |
0.38% |
0.50% |
0.70% |
0.80% |
0.90% |
|
10-Year Yield |
1.49% |
1.50% |
1.60% |
1.70% |
1.80% |
* Interest rate assumptions incorporated into MUFG foreign exchange forecasts.
The 10-year JGB yield increased again in March, by 11bps to close at 1.49%. The JGB yield move was in part sympathy with global yields, in particular in Europe, following Germany’s plans for a substantial increase in fiscal spending. Yields in the US were unchanged in March and hence once again the US-JP 10-year yield spread narrowed a further 11bps. The spread has now declined 85bps since the middle of January and at levels below 280bps is consistent with a much lower USD/JPY. The 10-year JGB yield has gained more than we had expected and hence we have raised our forecasts (from 1.50% in Q3 & 1.60% in Q4) given we see scope for investors gradually adjusting higher the implied terminal rate for the BoJ policy rate. Stronger inflation is more apparent today and the higher wage growth coming through and rising rental inflation and food prices will likely keep the BoJ on track to hike twice by January 2026 which is not priced in the OIS market. The primary risk to the view is a larger equity correction globally due to trade tariffs hitting growth and corporate earnings, prompting a larger USD/JPY drop and a BoJ pause
USD/JPY VS. SHORT TERM YIELD SPREADS

Source: Bloomberg, Macrobond
BOJ’S OUTRIGHT JGB PURCHASES
Euro
|
Spot close 31.03.25 |
Q2 2025 |
Q3 2025 |
Q4 2025 |
Q1 2026 |
|
|
EUR/USD |
1.0811 |
1.0600 |
1.0800 |
1.1000 |
1.1400 |
|
EUR/JPY |
161.83 |
161.10 |
162.00 |
162.80 |
166.40 |
|
Range |
Range |
Range |
Range |
||
|
EUR/USD |
1.0400-1.1100 |
1.0500-1.1300 |
1.0700-1.1500 |
1.0900-1.1800 |
|
|
EUR/JPY |
155.00-167.00 |
155.50-168.00 |
156.00-169.00 |
157.00-170.00 |
MARKET UPDATE
In March the euro strengthened notably versus the US dollar in terms of London closing rates, moving from 1.0400 to 1.0811. The ECB at its meeting in March cut the key policy rate by 25bps to 2.50%, and followed 125bp of cuts last year through to January this year. The ECB is running down APP securities and started PEPP run-off in July last year with about EUR 425bn of securities estimated to roll off the balance sheet in 2025.
OUTLOOK
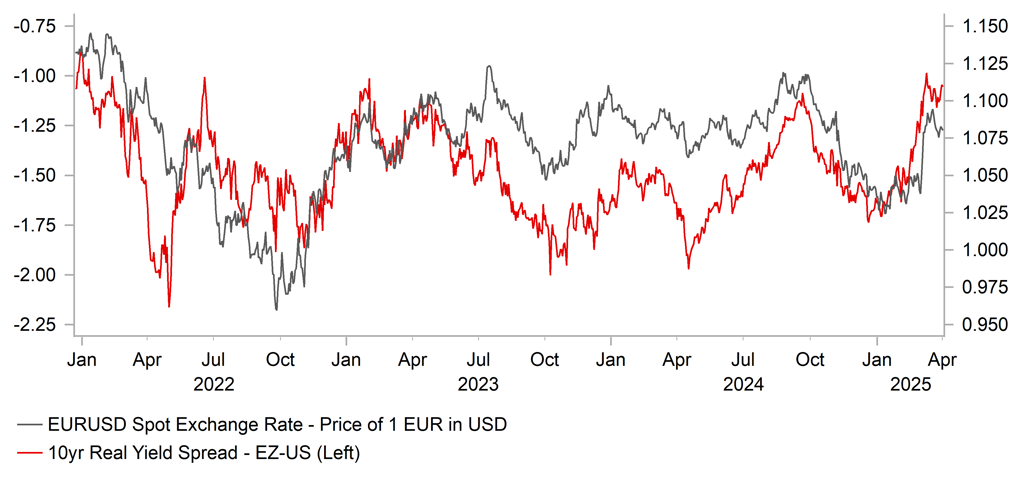
The euro advanced notably in March fuelled by the decision of Friedrich Merz to orchestrate a plan to substantially increase fiscal spending well above the limits under Germany’s constitutional debt brake. The EUR 500bn infrastructure fund utilised over twelve years and increased defence spending amounts to potentially EUR 1 trillion of additional spending and fully justified the sharp move higher in German bund yields. While the debt brake remains in place, the steps taken open up the prospect of greater fiscal flexibility in the euro-zone which is a growth-positive development over the medium term. The EU also announced scope for countries to borrow more to finance defence spending. We have raised our German GDP forecast for 2026 from 1.1% to 1.7% which will also feed into stronger euro-zone growth than originally expected. The German bund yield move on the day of the announcement saw a three standard deviation move that historically is indicative of a stronger euro versus the dollar over a one to two month period in particular.
However, the cloud of uncertainty over US trade tariff policy could serve to undermine the euro over the short-term. President Trump has announced a 25% tariff on global auto and auto parts imports that will negatively impact the euro-zone. According to the European Automobile Manufacturers’ Association (ACEA) in value terms, the US was the largest exporting market for the EU in 2024 worth EUR 38.5bn, although that was a decline of 4.6% versus 2023. We do not know the details of reciprocal tariffs to be announced on 2nd April but the EU’s Trade and Economic Security Commissioner, Marco Sefcovic has indicated his belief that the EU could be hit with a 20% tariff on all US imports. President Trump appears to have singled out the EU and we see greater risks of more aggressive action focused on Europe than elsewhere which could initially at least prompt some renewed EUR selling. The ECB is nearly fully priced for cutting the policy rate 25bps below the neutral rate of 2.00% but the two and three-year OIS pricing are higher pointing to a lack of conviction on policy being sustained below the neutral level. More aggressive tariff action might see more ECB cuts being priced that will then pressure EUR to the downside.
We have raised our EUR/USD forecast profile for each quarter this year by between 3-5 big figures and our first Q1 2026 estimate implies a 5%-6% appreciation in EUR/USD from current spot. However, given the sharp gains in March and given the tariff uncertainty, we see limited scope for further upside until later in the year.
INTEREST RATE OUTLOOK
|
Interest Rate Close |
Q2 2025 |
Q3 2025 |
Q4 2025 |
Q1 2026 |
|
|
Policy Rate |
2.50% |
2.00% |
2.00% |
2.00% |
2.00% |
|
3-Month Bill |
2.30% |
2.20% |
2.05% |
1.90% |
1.90% |
|
10-Year Yield |
2.74% |
2.60% |
2.70% |
2.80% |
3.00% |
* Interest rate assumptions incorporated into MUFG foreign exchange forecasts.
The 10-year bund yield surged in March by 33bps to close at 2.74%. The move came on one particular day – 5th March – when the incoming German Chancellor Friedrich Merz announced a plan for a huge increase in fiscal spending on infrastructure and defence. The upward revision to German GDP growth – 1.1% to 1.7% in 2026 – is significant and alters the medium-term growth outlook. An EU plan to allow for greater defence spending adds to the improved growth optimism. However, global uncertainties are high and the negative impact on growth from US tariffs and a possible decline in energy prices due to a potential Ukraine ceasefire will help dampen long-term yields. We continue to expect the ECB to cut the policy rate to 2.00%, the neutral rate. The OIS market implies an increased probability of a cut below the neutral rate in Q1 2026 but for now we are maintaining our view of a 2.00% terminal rate. A more aggressive tariff action by the US that is maintained for a longer period could then lead us to add one further ECB rate cut in Q1 2026. Much of the fiscal expansion has now been priced so we see limited further upside from here and risk of aggressive tariffs point to downside risks relative to the levels above.
EUR/USD VS. EZ-US 10YR YIELD SPREADS
Source: Bloomberg, Macrobond
US ECONOMIC OUTPERFORMANCE TO NARROW
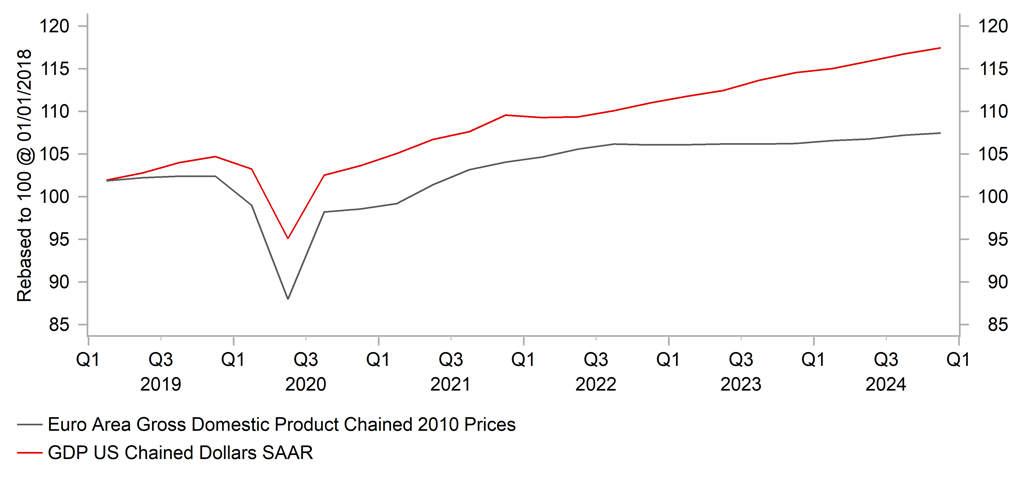
Source: Bloomberg, Macrobond
Pound Sterling
|
Spot close 31.03.25 |
Q2 2025 |
Q3 2025 |
Q4 2025 |
Q1 2026 |
|
|
EUR/GBP |
0.8368 |
0.8250 |
0.8350 |
0.8350 |
0.8400 |
|
GBP/USD |
1.2919 |
1.2850 |
1.2930 |
1.3170 |
1.3570 |
|
GBP/JPY |
193.38 |
195.30 |
194.00 |
195.00 |
198.10 |
|
Range |
Range |
Range |
Range |
||
|
GBP/USD |
1.2500-1.3400 |
1.2600-1.3500 |
1.2700-1.3700 |
1.2800-1.3900 |
MARKET UPDATE
In March the pound strengthened against the US dollar in terms of London closing rates from 1.2583 to 1.2919. However, the pound weakened against the euro from 0.8265 to 0.8368. The MPC at its meeting in March kept the key policy rate unchanged at 4.50% following the cut in February, the third 25bp cut in this easing cycle. The MPC also cut the key policy in August and November last year.
OUTLOOK
The pound advanced versus the dollar but weakened against the euro in March but on a BoE TWI basis managed to advance by 0.8%. Rate spreads continue to play a key role in supporting the pound. The 2-year UK-US swap spread and the 10-year Gilt-UST bond spread are moving very tightly with GBP/USD with declines in US yields not matched in the UK helping to fuel GBP demand. The macro data has been mixed but the employment data and the wage data certainly pointed to justification for a continued cautious approach to monetary easing by the BoE. The average weekly earnings 3mth YoY rate excluding bonuses remained elevated at 5.9% in January. Employment (PAYE data) data was stronger than expected and the advance services PMI was also stronger pointing to the potential for better consumer spending data ahead. That makes sense given the wage data points to continued growth in real incomes. The MPC meeting in March revealed continued caution with the guidance maintained that a “gradual and careful approach” to further easing was appropriate. We see “gradual and careful” as being one 25bp cut per quarter and hence view the OIS market as under-priced for three rate cuts by March 2026.
What could help the MPC to deliver those three rate cuts are the steps taken in March by the government to cut government spending. After the Gilt sell-off in January and weaker GDP growth, the government saw it’s GBP 9.9bn of fiscal headroom disappear and ended up with a GBP 4.1bn deficit. The GBP 14bn savings required to return that headroom were primarily through cuts to welfare and departmental spending. The OBR also helped with a generous assumption that relaxed planning rules would boost housing construction to such an extent to add a further GBP 3.4bn of revenues. The problem however is that the government is once again at the mercy of markets and growth and given the level of global uncertainties, a larger fiscal cushion would have been ideal. There is a risk now that fiscal credibility is hit again and that is a GBP downside risk over the forecast period.
We expect the pound to advance versus the US dollar in H2 as the dollar weakens more broadly. Over the coming quarter there is scope for the pound to outperform. If tariffs are the focus the UK is better positioned to weather the policies from the US given the smaller goods exports than many other major developed economies. The risk is therefore higher that the ECB could cut rates more actively in the nearer-term. Still, overall, our EUR/GBP range is modest implying relative stability with pound gains mainly taking place versus the dollar in H2 2025.
INTEREST RATE OUTLOOK
|
Interest Rate Close |
Q2 2025 |
Q3 2025 |
Q4 2025 |
Q1 2026 |
|
|
Policy Rate |
4.50% |
4.25% |
4.00% |
3.75% |
3.50% |
|
3-Month Bill |
4.54% |
4.30% |
3.95% |
3.70% |
3.55% |
|
10-Year Yield |
4.68% |
4.50% |
4.40% |
4.30% |
4.30% |
* Interest rate assumptions incorporated into MUFG foreign exchange forecasts.
The 10-year Gilt yield jumped in March, by 20bps to close at 4.68%. The jump was very much in sympathy with the surge in yields in Germany in response to the fiscal spending package. The UK will also increase spending on defence but this will be financed from a cut to overseas aid. The 10-year Gilt yield move was less than the Bund yield move higher in Germany with fiscal constraint the focus in the UK. The Budget Statement announced GBP 14bn worth of savings, mostly through spending cuts, that could weigh on growth later this year. Sentiment could deteriorate further if growth is weaker and pressure builds on the government to announce further savings or are forced to raise taxes. How severe Trump’s reciprocal trade tariff policies are will quickly determine whether fiscal risks return quickly or not. That could result in an unwarranted to move higher in Gilt yields and is a key risk to our forecast above. Our forecast is primarily based on the view that inflation will slow in H2 and a slowdown in wage growth will encourage to MPC to cut by 25bps each quarter. With global uncertainties high we see that as plausible which when done in a “careful and gradual” manner will allow for the 10-year Gilt yield to decline gradually.
GBP/USD VS. SHORT TERM SWAP SPREADS
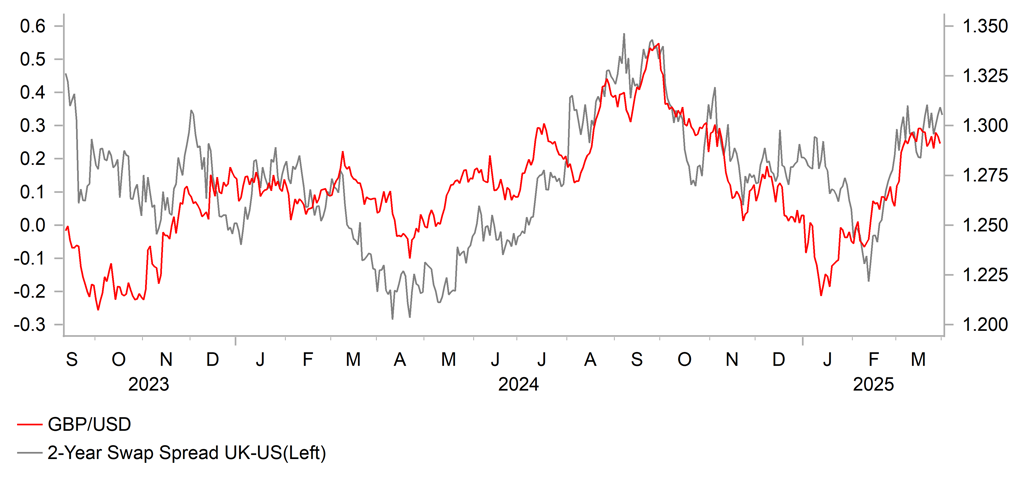
Source: Bloomberg, Macrobond
UK REAL AVERAGE EARNINGS YOY, %
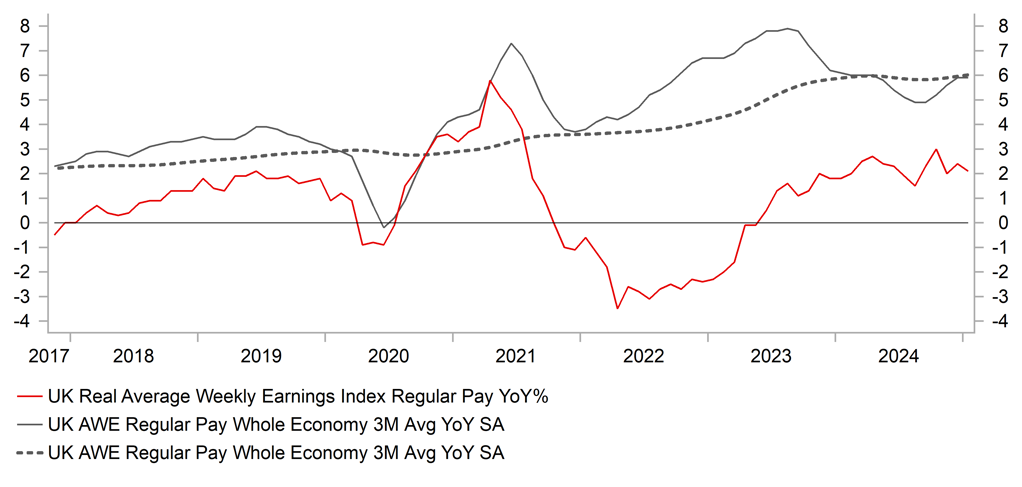
Source: Bloomberg, Macrobond
Chinese renminbi
|
|
Spot close 31.03.25 |
Q2 2025 |
Q3 2025 |
Q4 2025 |
Q1 2026 |
|
USD/CNY |
7.2564 |
7.4000 |
7.4000 |
7.3500 |
7.3000 |
|
USD/HKD |
7.7801 |
7.7800 |
7.7700 |
7.7700 |
7.7700 |
|
Range |
Range |
Range |
Range |
||
|
USD/CNY |
7.1000-7.6000 |
7.1000-7.6000 |
7.0500-7.5500 |
7.0000-7.4500 |
|
|
USD/HKD |
7.7400-7.8200 |
7.7300-7.8100 |
7.7300-7.8100 |
7.7300-7.8100 |
MARKET UPDATE
In March, USD/CNY fell from 7.2778 to 7.2564. On 20th March, the PBoC kept the 1Y and 5Y LPR at 3.10% and 3.60% respectively. In the press conference on economy during the 14th NPC on 6th March, the PBoC governor mentioned cutting policy rates and the RRR at appropriate times.
OUTLOOK
A series of policy announcements from the government in March have sent a clear signal to support growth. On 16th March, the General Office of the Communist Party of China Central Committee and the General Office of the State Council announced “special initiatives” to boost consumption, also known as the “30-point” plan. The key measures are to increase residents’ income, provide subsidies for special groups, increase demand and supply for services consumption and improve the condition for consumption, among others. In fact, we have already seen the positive impact of government policies in the January-February macro data. While the macro data was mixed, we saw that state-led enterprises and infrastructure investment drove the stronger growth of FAI. There was also a growth surge in communication appliance retail sales thanks to the expanded consumer goods trade-in program announced on 8th January as well as better-than-expected industrial production growth. Looking ahead, we think the negative impacts of the additional 20% US tariffs already implemented since February will start to manifest in the coming months, though Premier Li Qiang signalled at China Development Forum held on 23rd March that the government would react to external shocks accordingly. Meanwhile, the March official manufacturing and non-manufacturing PMIs fared better-than-expected, at 50.5 and 50.8 respectively – both higher than the January-February averages.
CNY had remained largely stable (+0.4%) against the US dollar thanks to the much weaker US dollar (DXY index down by 3.1%). That said, the USD/CNY fixing was kept at around the 7.1700-level with no intention from the PBoC to meaningfully adjust it lower. USD/CNY spot is currently trading at the mid-point between the fixing level and the upper band. We interpret it as the PBoC sending a message to the market that CNY movement will not be easily swayed by market movement, be it CNY-positive (e.g., weaker DXY) or negative (e.g., US tariffs), and that a stable currency is their preference. Judging from recent economic data, we think the negative impact of the tariffs has yet to be reflected in the economy and therefore the current USD/CNY level has not priced in much of that risk. While China has diversified its exports trade from US since trade war 1.0, the US remains a significant export market for China (second largest exports market after ASEAN with 14.7% share) and the negative impact of the tariffs will be felt eventually. As such, we expect further CNY weakness but only a modest move given we expect a weaker US dollar in 2H 2025 and renewed easing by the Federal Reserve. We think USD/CNY will reach a peak of 7.4000 by Q2 2025, which also factors in a PBoC rate cut in Q2.
INTEREST RATE OUTLOOK
|
Interest Rate Close |
Q2 2025 |
Q3 2025 |
Q4 2025 |
Q1 2026 |
|
|
LPR 1Y |
3.10% |
2.90% |
2.70% |
2.70% |
2.70% |
|
MLF 1Y |
2.00% |
1.70% |
1.50% |
1.50% |
1.50% |
|
7-Day Repo Rate |
1.50% |
1.30% |
1.10% |
1.10% |
1.10% |
|
10-Year Yield |
1.82% |
1.80% |
1.80% |
1.90% |
2.00% |
* Interest rate assumptions incorporated into MUFG foreign exchange forecasts.
In March, the 7-day interbank repo rate remained elevated and ended the month around 2.00%, which is the upper band of the interest rate corridor. While a RRR cut or a 7-day reverse repo rate cut would be useful to provide liquidity as well as supporting the real economy, the dilemma the PBoC is facing is a potential weaker CNY if they choose to do so. The banks reportedly will also start raising consumer loan interest rates to no less than 3% starting in April. This is at odds with the National Financial Regulatory Administration (NFRA) guidance released on 14th March to encourage financial institutions to expand consumer finance to boost consumption (e.g., issue more personal consumer loans). The upward adjustment of consumer loan rates highlights the challenges facing banks given a low net profit margin. Barring any sizable upward movement of USD/CNY after 2nd April, we think the PBoC will likely reduce 7-day reverse repo rate or RRR sooner rather than later in Q2 to support the real economy given the elevated real interest rates. We expect a 20bps cut each in Q2 and Q3.
USD/CNY SPOT IS NOW AT MID-POINT BETWEEN FIXING AND UPPER BAND
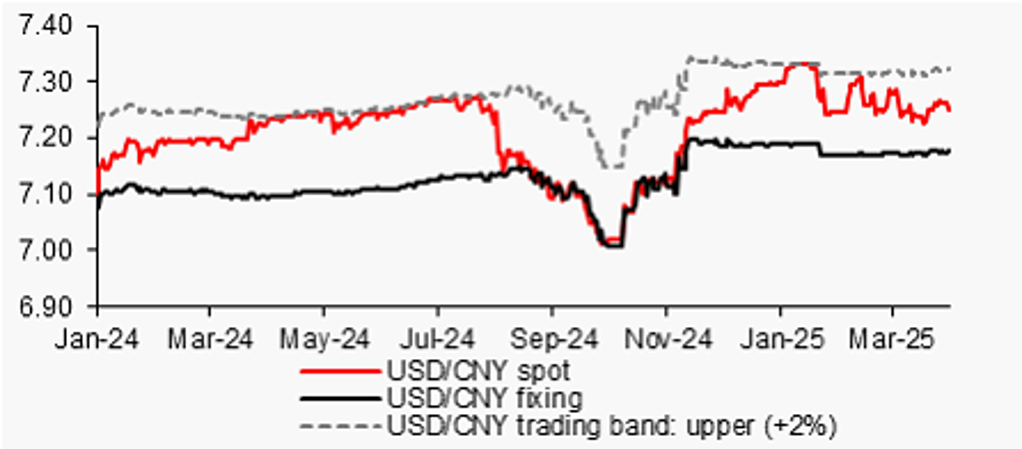
Source: : Bloomberg, MUFG GMR
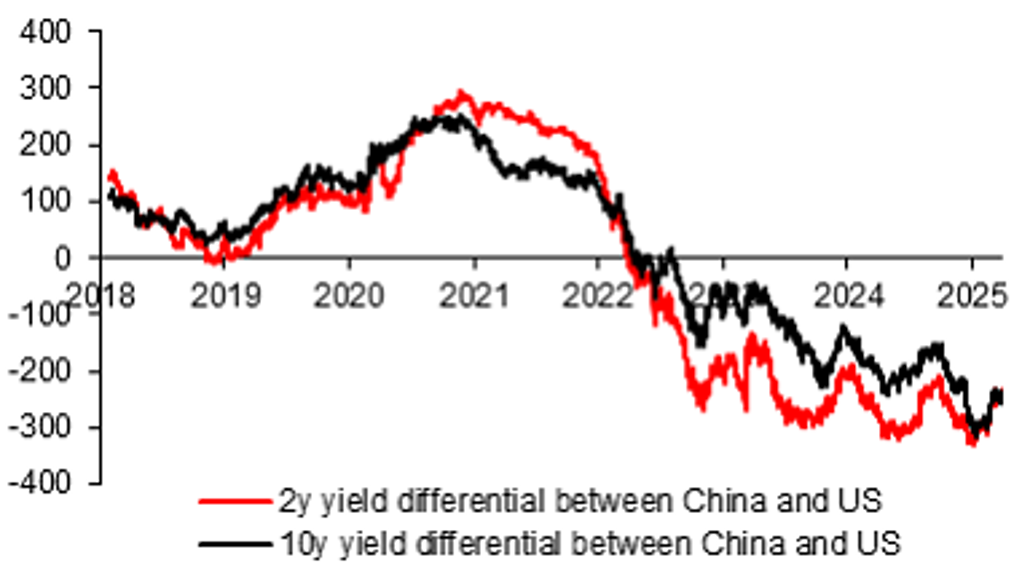
CHINA NEGATIVE YIELD DIFFERENTIAL WITH US NARROWED SOMEWHAT
Source: : Bloomberg, MUFG GMR

