Please download PDF from above for the themes of the year & the following currencies.
Australian dollar // New Zealand dollar //Canadian dollar // Norwegian krone // Swedish Krona // Swiss franc // Czech koruna // Hungarian forint //Polish zloty // Romanian leu // Russian rouble // South African rand // Turkish lira // Indian rupee // Indonesian rupiah // Malaysian ringgit // Philippine peso //Singapore dollar // South Korean won // Taiwan dollar // Thai baht // Vietnamese dong // Argentine peso // Brazilian real // Chilean peso // Mexican peso // Crude oil // Saudi riyal // Egyptian pound
Annual Foreign Exchange Outlook
DEREK HALPENNY
Head of Research, Global Markets EMEA and International Securities
Global Markets Research
Global Markets Division for EMEA
E: derek.halpenny@uk.mufg.jp
LEE HARDMAN
Senior Currency Analyst
Global Markets Research
Global Markets Division for EMEA
E: lee.hardman@uk.mufg.jp
LIN LI
Head of Global Markets Research Asia
Global Markets Research
Global Markets Division for Asia
E: lin_li@hk.mufg.jp
MICHAEL WAN
Senior Currency Analyst
Global Markets Research
Global Markets Division for Asia
E: michael_wan@sg.mufg.jp
LLOYD CHAN
Senior Currency Analyst
Global Markets Research
Global Markets Division for Asia
E: lloyd_chan@sg.mufg.jp
EHSAN KHOMAN
Head of Commodities, ESG and Emerging Markets Research – EMEA
DIFC Branch – Dubai
E: ehsan.khoman@ae.mufg.jp
SOOJIN KIM
Analyst, ESG and Emerging Markets Research – EMEA
DIFC Branch – Dubai
E: soojin.kim@ae.mufg.jp
MUFG Bank, Ltd.
A member of MUFG, a global financial group
January 2025
KEY EVENTS IN THE MONTH AHEAD
2025 THEMES
In this the first edition of Foreign Exchange Outlook in 2025, as in previous years we have added an additional section – 2025 Themes – highlighting what we believe will be some of the key themes/risks for the financial markets this year. We have included five such themes for the year ahead and cover these in more depth. We hope you find some value in this additional section and welcome any feedback.
FURTHER USD STRENGTH BEFORE REVERSAL IN H2
The US dollar surged by 7.0% (DXY basis) in 2024 after a 2.3% drop in 2023. It was the third year in four when the dollar advanced by over 5.0%. All of the dollar strength in 2024 came in the final quarter of the year as market participants positioned for a Trump election victory. Confirmation of that victory and comments from Trump since have raised expectations of trade tariff announcements on the day of inauguration (20th January) or in the days immediately after. We expect trade tariffs to be the focus and market expectations will not be disappointed with much more widespread action from the start than in Trump’s first term in office. We may also see a post-election bounce in activity which is already evident in the sentiment data. However, policy remains restrictive and beyond this period (Q1 into Q2) we see the economy slowing and the Fed cutting rates further following a pause that could feasibly last through to May. Slower growth and a more active FOMC in cutting rates in H2 should then see the dollar partially reverse the dollar strength recorded since Q4 last year.
EUR TO BREAK PARITY & THEN RECOVER
There is a long list of negatives for EUR that explain the 7.5% drop in Q4 that looks set to extend the decline in EUR/USD further. Still, a lot is now priced so while we see a break of parity as now very likely, we do not expect a sustained move lower. A key risk to our view of some EUR recovery in H2 is political uncertainty with another general election in France possible from July 2025 onwards.
JPY TO FINALLY RECOVER
The yen weakened sharply again last year – the fourth year of depreciation versus the dollar. In the four years since 2020, USD/JPY is 52% higher. A more cautious than expected BoJ helped fuel renewed yen selling but we still expect the BoJ to hike by more than currently priced. With the FOMC to cut by more than currently priced we expect this to lead to the first calendar year of decline in USD/JPY since 2020.
CNY WEAKENS ON TARIFFS AND SLOWER CHINA GROWTH
USD/CNY increases to 7.5000 by Q2 before reaching 7.4000 by Q4. The modest CNY depreciation is largely helped by the dollar’s 7% trend deprecation starting from Q2. Weaker CNY and China growth weigh on Asian peers, however, country specific factors will play a more important role in driving individual currency movement in 2025, which explains INR and THB being the worst performing currency for the year.
Forecast rates against the US dollar - End-Q1 to End-Q4 2025
|
Spot close 31.12.24 |
Q1 2025 |
Q2 2025 |
Q3 2025 |
Q4 2025 |
|
|
JPY |
156.78 |
154.00 |
152.00 |
150.00 |
148.00 |
|
EUR |
1.0400 |
0.9900 |
1.0200 |
1.0500 |
1.0800 |
|
GBP |
1.2538 |
1.2000 |
1.2440 |
1.2800 |
1.3010 |
|
CNY |
7.2993 |
7.4000 |
7.5000 |
7.5000 |
7.4000 |
|
AUD |
0.6205 |
0.5900 |
0.6000 |
0.6200 |
0.6400 |
|
NZD |
0.5615 |
0.5350 |
0.5400 |
0.5600 |
0.5800 |
|
CAD |
1.4385 |
1.4500 |
1.4400 |
1.4200 |
1.3900 |
|
NOK |
11.331 |
12.020 |
11.863 |
11.619 |
11.019 |
|
SEK |
11.010 |
11.717 |
11.569 |
11.333 |
10.833 |
|
CHF |
0.9059 |
0.9390 |
0.9020 |
0.8860 |
0.8700 |
|
|
|
|
|
|
|
|
CZK |
24.194 |
25.560 |
24.900 |
24.290 |
23.700 |
|
HUF |
395.16 |
420.20 |
410.80 |
401.90 |
393.50 |
|
PLN |
4.1102 |
4.3330 |
4.2250 |
4.1240 |
4.0280 |
|
RON |
4.7822 |
5.0300 |
4.9020 |
4.7900 |
4.6850 |
|
RUB |
112.11 |
114.52 |
116.95 |
119.32 |
121.62 |
|
ZAR |
18.855 |
19.250 |
19.500 |
19.250 |
19.000 |
|
TRY |
35.366 |
37.250 |
39.250 |
41.250 |
43.250 |
|
|
|
|
|
|
|
|
INR |
85.605 |
86.800 |
87.500 |
88.000 |
88.500 |
|
IDR |
16127 |
16250 |
16210 |
16170 |
16100 |
|
MYR |
4.4690 |
4.5700 |
4.5500 |
4.5200 |
4.4800 |
|
PHP |
57.945 |
59.700 |
59.300 |
59.000 |
58.800 |
|
SGD |
1.3628 |
1.3800 |
1.3750 |
1.3700 |
1.3650 |
|
KRW |
1473.7 |
1480.0 |
1500.0 |
1500.0 |
1470.0 |
|
TWD |
32.785 |
33.200 |
33.400 |
33.300 |
33.100 |
|
THB |
34.315 |
35.900 |
36.000 |
35.700 |
35.500 |
|
VND |
25485 |
25800 |
25900 |
25800 |
25700 |
|
|
|
|
|
|
|
|
ARS |
1030.4 |
1110.0 |
1200.0 |
1310.0 |
1500.0 |
|
BRL |
6.1658 |
6.4000 |
6.6000 |
6.5000 |
6.4000 |
|
CLP |
993.50 |
1040.0 |
1060.0 |
1070.0 |
1050.0 |
|
MXN |
20.767 |
21.750 |
21.500 |
21.000 |
21.000 |
|
|
|||||
|
Brent |
74.28 |
73.00 |
69.00 |
74.00 |
77.00 |
|
NYMEX |
71.44 |
68.00 |
64.00 |
69.00 |
72.00 |
|
SAR |
3.7557 |
3.7500 |
3.7500 |
3.7500 |
3.7500 |
|
EGP |
50.793 |
49.700 |
49.300 |
49.100 |
48.700 |
Notes: All FX rates are expressed as units of currency per US dollar bar EUR, GBP, AUD and NZD which are expressed as dollars per unit of currency. Data source spot close; Bloomberg closing rate as of 12:30pm London time, except VND which is local onshore closing rate.
2025
Theme 1:
Trump and the US dollar – it could get complicated
- Q4 USD surge signals market well positioned for Trump’s policies
- But Trump 2.0 will differ from Trump 1.0 limiting scope for USD strength
- We see USD appreciation in Q1-Q2 fading and depreciation in H2
Theme 2:
Asia FXs are to navigate against high uncertainty and upheavals
- Key themes, including Trump’s trade policies, China’s stimulus and economic development, how China copes with higher US tariffs, semiconductor activity, and a weaker US dollar cycle starting from Q2, all will play on Asian FX.
- We expect USD/CNY to increase to 7.5000 in mid-2025 on an additional 20ppts US’s average tariffs on China products and potential wider negative China-US yield spread, and to end the year at 7.4000 due to US dollar’s weakness.
- Currencies of export-oriented economies with a large exposure to China’s economy, are likely more pressured by tariffs, such as KRW, MYR, SGD, and TWD, while we see PHP and INR as more insulated from trade shocks. However, country specific factors in 2025 will play a more important role in driving individual currencies compared with prior year. In fact, we see INR as the worst performing currency in 2025 due to its persistent balance of payments deficits at least in 1H2025, followed by THB, due to Thailand’s widening negative bond yield spread with the US and incurred larger capital outflows pressure.
- The forecasted changes of Asian FXs in 2025 are modest, partly due to a benign outlook of a weakening US dollar (about 7% depreciation of the US dollar starting from Q2), which is distinctively different from the 10% US dollar appreciation during Trade War 1.0 period.
- Having said the above, there are risks to our forecasts, including the magnitude of Trump’s tariffs, how other countries will respond, how effective China’s stimulus will be, geopolitical risks and the US dollar’s path in 2025.
Theme 3:
US Outlook: A Balancing Act
- President Trump’s second term in the oval office will need to see his administration balance several priorities: how far to go on tariffs, address fiscal sustainability vs. tax policy, deregulation, and economic growth
- Our base-case for the Fed is 75bps of cuts in 2025, with the Fed cutting at every other meeting starting in March. However, there is a risk of a longer pause as the Fed monitors how Trump’s first 100-days impacts the economy and inflation. We also expect a full tapering of QT by Q2.
- Aside from the 2-year note (which will take its cue from the Fed), we expect the rest of the Treasury curve to remain above 4% in 2025
Theme 4:
Winners & losers in EM FX in a Trump 2nd term
- EM currencies have already weakened sharply in anticipation of Trump’s second term as president.
- The more challenging external backdrop including the Fed’s less accommodative policy stance will diminish the relative attractiveness of EM assets and dampen capital inflows.
- In the following piece we look into which EM currencies are more or less exposed to Trump policy risks in the year ahead.
Theme 5:
Commodities – stay selective, hedge Trump-induced tail risks
- The sweeping pivots in US trade, energy and fiscal policy in a governing “trifecta” Trump 2.0 mandate from a timing, magnitude and sequencing perspective strengthens the diversification play commodities offer portfolio allocations in 2025
- We recommend a selective commodities bias in 2025 given differentiation in fundamentals alongside the unusually wide distribution of Trump-induced policy shifts – energy (neutral-to-bearish), base metals (neutral-to-bullish), precious metals (bullish) and agriculture (neutral)
US dollar
|
Spot close 31.12.24 |
Q1 2025 |
Q2 2025 |
Q3 2025 |
Q4 2025 |
|
|
USD/JPY |
156.78 |
154.00 |
152.00 |
150.00 |
148.00 |
|
EUR/USD |
1.0400 |
0.9900 |
1.0200 |
1.0500 |
1.0800 |
|
Range |
Range |
Range |
Range |
||
|
USD/JPY |
145.00-160.00 |
143.00-158.00 |
141.00-156.00 |
139.00-154.00 |
|
|
EUR/USD |
0.9700-1.0500 |
0.9900-1.0700 |
1.0100-1.0900 |
1.0300-1.1100 |
MARKET UPDATE
In 2024 the US dollar strengthened against the euro in terms of London closing rates from 1.1059 to 1.0400. The intra-day high was 1.1214 in September and the intra-day low was 1.0335 in November. The dollar strengthened against the yen also from 140.96 to 156.78. The intra-day high was 161.95 in July and the intra-day low was 139.58 in September. The FOMC cut the federal funds rate by a 100bps to 4.25%-4.50%. The pace of QT was adjusted by the Fed and was reduced from June from USD 60bn worth of US Treasuries rolling off the balance sheet to USD 25bn. MBS securities are rolling off the balance sheet at a pace up to USD 35bn per month. Assets on the Fed’s balance sheet declined from USD 7,713bn at the end of 2023 to USD 6,886bn at the end of last year.
OUTLOOK
The US dollar, on a DXY basis, strengthened by 7.0% in 2024 and was the third year in four in which the dollar gained. From the post-covid low-point at the start of 2021 the US dollar has advanced by 20%. This leaves the dollar at elevated levels and while we see scope for further gains as Trump begins to announce and implement his policies, a lot is now priced and hence we are assuming relatively modest further appreciation from current levels. A break below parity in EUR/USD looks likely now but levels below parity will only be sustained if we see market participants price a further widening of divergence, which we see as unlikely. The US economy is still set to slow as the impact of tight monetary policy and the fading support of covid-related stimulus weakens consumption. Data by BankRegData revealed that US credit card lenders wrote off USD 46bn of seriously delinquent loans through 2024 to September, a 50% increase on the same period in 2023 and the highest level in 14yrs during the GFC. We may witness a short-term post-election bounce in sentiment and activity but we expect that to fade quickly and data will then point more clearly to slower growth ahead as high rates and tapped out consumers weigh on overall economic activity even with inflation higher than usual due to tariffs.
The short-term bounce post-election could see the FOMC pause for longer than we currently assume. There is also a seasonal bias to higher inflation prints in Q1 that could reinforce the FOMC’s willingness to pause, especially as time will be needed to assess the impact of announced trade tariffs. However, we would still expect the FOMC to cut by more later this year as the economy starts to slow more clearly. Cuts to government spending driven by Elon Musk and DOGE is another factor that could see increase public sector job cuts and add to downside growth risks ahead.
We expect peak focus on trade tariffs to come in the earlier part of this year coinciding with the initial wave of announcements. The dollar will therefore peak around the same time and then as the economy weakens and the Fed becomes more active in cutting rates than currently priced, the dollar will weaken in H2 2025.
INTEREST RATE OUTLOOK
|
Interest Rate Close |
Q1 2025 |
Q2 2025 |
Q3 2025 |
Q4 2025 |
|
|
Policy Rate |
4.33% |
4.13% |
3.88% |
3.63% |
3.63% |
|
3-Month T-Bill |
4.29% |
4.01% |
3.76% |
3.55% |
3.58% |
|
10-Year Yield |
4.60% |
4.50% |
4.38% |
4.50% |
4.38% |
* Interest rate assumptions incorporated into MUFG foreign exchange forecasts.
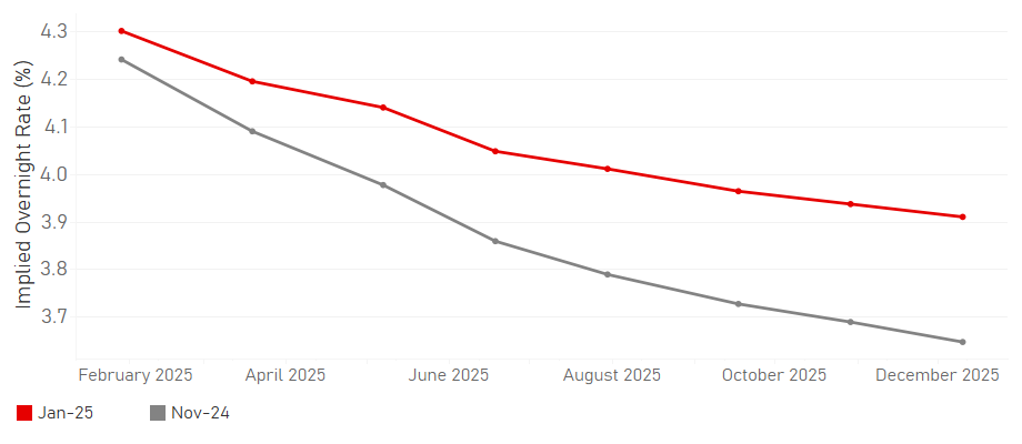
We view the first 100bps in cuts as a down payment on the rates normalization process. That said, the next 100bps of cuts (if fully delivered) will likely be drawn out in the quarters ahead. For now, we maintain that the Fed should continue to move towards the long-run neutral rate of roughly 3%. At a minimum we expect the Fed to only cut rates at SEP quarterly meetings (March, June and September). They will not cut in January and it is possible that they may even skip in March if data does not decelerate and economic actors respond favorable to the incoming administration. With RRP shrinking and the rate realigned, in terms of QT B/S policy, we expect an announcement to be made in Q1 to start a full UST tapering and shift MBS proceeds into UST add-ons later in the year. The 2-year note aside, we expect the rest of the Treasury curve to remain above 4% in 2025. However, even with the 2-year note, if the Fed goes on a longer pause, there is upside risk to our 2-year forecast. Overall, the best risk-reward is to remain with front-end longs and in steepeners.
(George Goncalves)
FED CUTS PRICED JANUARY-2025 VS. NOVEMBER 2025
Source: MUFG GMR, Bloomberg
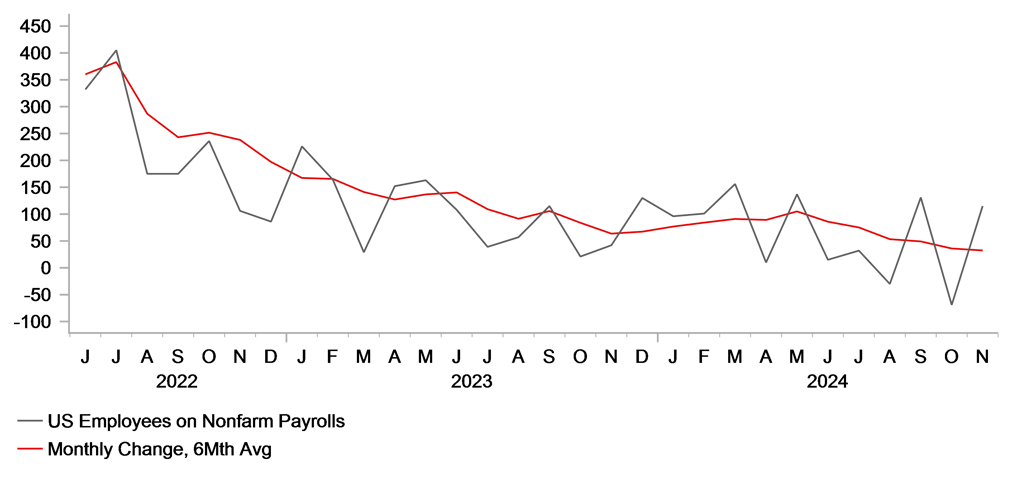
NFP HISTORICAL PERFORMANCE
Source: Bloomberg, Macrobond
Japanese yen
|
Spot close 31.12.24 |
Q1 2025 |
Q2 2025 |
Q3 2025 |
Q4 2025 |
|
|
USD/JPY |
156.78 |
154.00 |
152.00 |
150.00 |
148.00 |
|
EUR/JPY |
163.05 |
152.50 |
155.00 |
157.50 |
159.80 |
|
Range |
Range |
Range |
Range |
||
|
USD/JPY |
145.00-160.00 |
143.00-158.00 |
141.00-156.00 |
139.00-154.00 |
|
|
EUR/JPY |
151.00-166.00 |
152.00-167.00 |
153.00-168.00 |
154.00-169.00 |
MARKET UPDATE
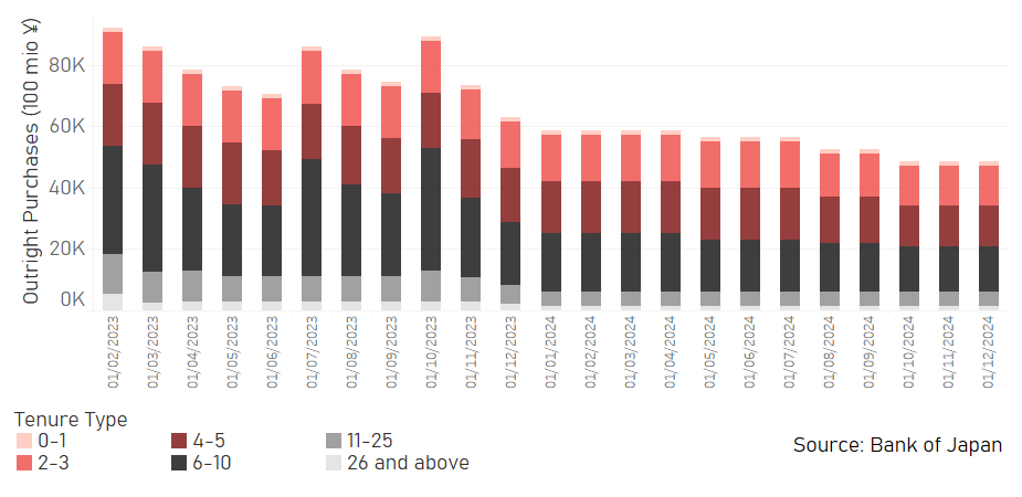
In 2024 the yen weakened notably against the US dollar in terms of London closing rates, from 140.96 to 156.78. The intra-day high was 161.95 in July and the intra-day low was 139.58 in September. In addition, the yen weakened against the euro from 155.89 to 163.05. The intra-day high was 175.43 in July and the intra-day low was 154.42 in August. In March the BoJ terminated the Kuroda QQE/NIRP monetary policy framework and set a rate of 0.10% to be paid on excess reserves at the BoJ. In July, the BoJ lifted rate by a further 15bps taking the key policy rate to 0.25%. The BoJ also announced in July that it was cutting the pace of monthly JGB buying by JPY 400bn per quarter, with purchases estimated to fall to JPY 2.9trn by Q1 2026. This reduction was estimated to reduce the BoJ’s balance sheet by 7%-8%.
OUTLOOK
The yen weakened by over 10% last year and was the 3rd worst performing G10 currency with yen selling driven by the still substantial divergence in monetary policy outlook. The BoJ did raise rates in 2024 by 35bps in total with the yen surging in value around the time of the second hike in July. However, the BoJ has not followed through with additional hikes since then and toward the end of last year was cautious in its communications on the timing of another rate hike. The BoJ’s caution likely also reflected a new incoming government with the LDP now no longer holding a majority in the Diet after a bad election result. The LDP is dependent on support from the main opposition party – the DPP – and in the early stages of this new political landscape in Japan, the BoJ has turned more cautious possibly reflecting less political consensus for additional rate hikes.
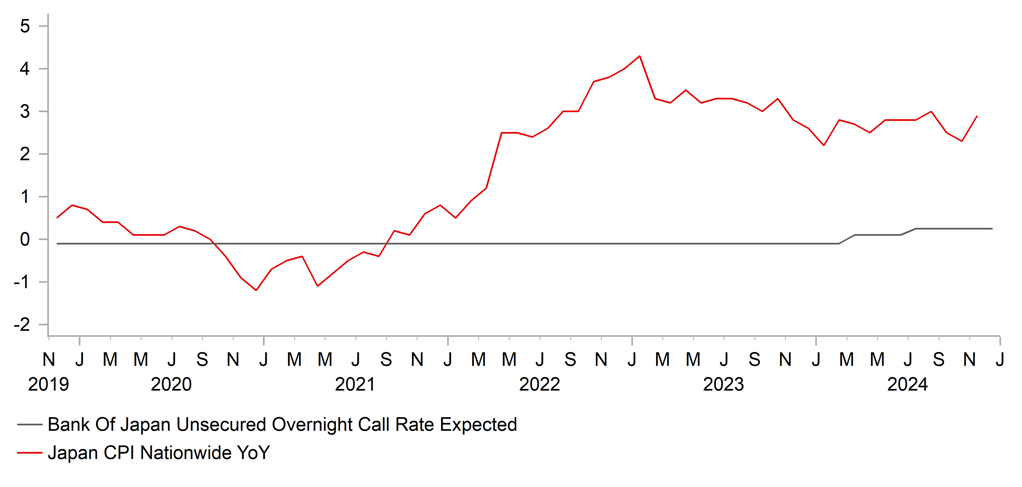
That said we still believe there are clear reasons for the BoJ to hike further this year. The BoJ has been consistent in arguing that the fundamental backdrop in Japan is consistent with the need for further rate hikes. The “virtuous circle” of rising wages and inflation remains intact and should be confirmed in the coming months as the ‘shunto’ wage negotiations commence. Rengo, the main union federation in Japan, has called for a wage increase of “around 5%”. Underlying inflation continues to strengthen with the services PPI YoY rate for companies with a high labour cost ratio hitting a new record high of 3.2% (ex-sales tax). Governor Ueda has hinted that the BoJ wishes to see more information on wage negotiations. Governor Ueda also stated the BoJ wanted to assess the possible impact from Trump trade policies. This makes a January hike therefore less likely but certainly still possible and we expect two rate hikes this year taking the key policy rate to 0.75%.
The delay to a rate hike by the BoJ and the increased caution by the Fed in cutting rates further was the perfect scenario for renewed USD/JPY buying. We see limited scope for further gains with intervention a growing risk. As 2025 unfolds we expect BoJ and Fed action to help push USD/JPY lower.
INTEREST RATE OUTLOOK
|
Interest Rate Close |
Q1 2025 |
Q2 2025 |
Q3 2025 |
Q4 2025 |
|
|
Policy Rate |
0.25% |
0.50% |
0.50% |
0.75% |
0.75% |
|
3-Month Bill |
0.22% |
0.70% |
0.85% |
0.90% |
0.95% |
|
10-Year Yield |
1.10% |
1.20% |
1.25% |
1.30% |
1.40% |
* Interest rate assumptions incorporated into MUFG foreign exchange forecasts.
The 10-year JGB yield increased in 2024 by 49bps to close at 1.10%, the highest calendar year close since July 2011 before negative rates and Governor Kuroda’s time at the BoJ marked by ultra-easy monetary policies. The rise was helped by the BoJ ending negative rates, lifting the key policy rate twice by a total of 35bps to 0.25%. The communications from the BoJ of late does point to the potential for inaction over the coming BoJ meetings with Governor Ueda wanting more information on wage negotiations (‘shunto’) and tim to assess US trade policy steps. But we see the monetary policy board as slowly turning more hawkish. The recent minutes suggested growing support for rate hikes ahead. Political instability is a risk that could see the BoJ maintain caution but the flip side of that is that if political instability fuels yen selling, it may encourage the BoJ to hike. We see the policy rate being lifted two times to 0.75% this year although there are downside risks to that view. More hikes, steady underlying inflation and elevated 10-year yields abroad should see the 10-year JGB yield drift further higher this year
BOJ POLICY RATE VS. JAPAN CPI YOY
Source: Bloomberg, Macrobond
BOJ JGB PURCHASES
Source: Bank of Japan
Euro
|
Spot close 31.12.24 |
Q1 2025 |
Q2 2025 |
Q3 2025 |
Q4 2025 |
|
|
EUR/USD |
1.0400 |
0.9900 |
1.0200 |
1.0500 |
1.0800 |
|
EUR/JPY |
163.05 |
152.50 |
155.00 |
157.50 |
159.80 |
|
Range |
Range |
Range |
Range |
||
|
EUR/USD |
0.9700-1.0500 |
0.9900-1.0700 |
1.0100-1.0900 |
1.0300-1.1100 |
|
|
EUR/JPY |
151.00-166.00 |
152.00-167.00 |
153.00-168.00 |
154.00-169.00 |
MARKET UPDATE
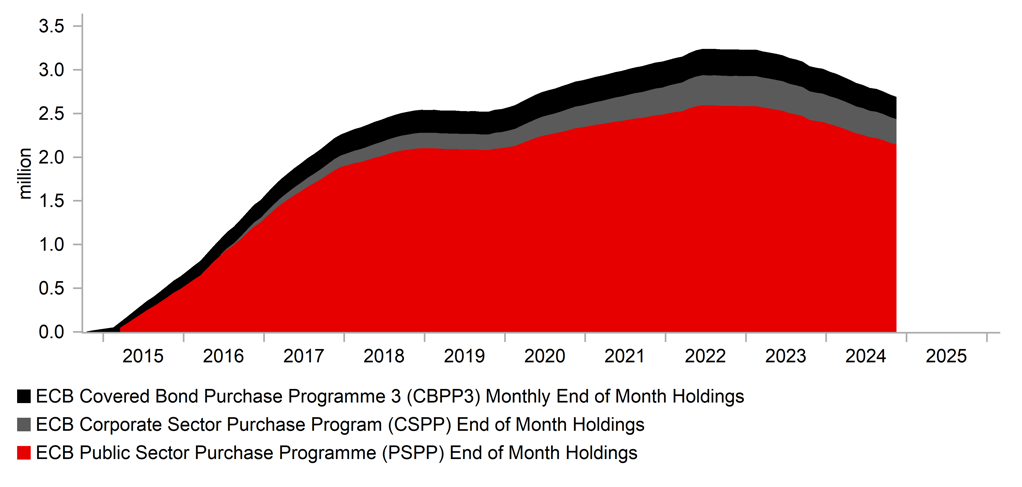
In 2024 the euro weakened against the US dollar in terms of London closing rates from 1.1059 to 1.0400. The intra-day high was 1.1214 in September and the intra-day low was 1.0335 in November. Following the aggressive policy tightening in 2022 and 2023 the ECB began reversing course in June by cutting by 25bps to 3.75%. after skipping a policy easing in July, the ECB then cut at the final three meetings of the year taking the policy rate to 3.00%. QT proceeded throughout the year with the Asset Purchase Program (APP) down EUR 328bn at EUR 2.698trn as of end-November. The TLTRO balance was essentially close to zero, down from EUR 396bn at the end of 2023. The PEPP balance was close to unchanged at EUR 1.62trn. Total assets on the ECB’s balance sheet fell EUR 584bn as of 12th Dec.
OUTLOOK
As can be seen from the intra-day high, the entire drop in EUR/USD took place in Q4 as investors positioned for a second Trump presidency. The 7.0% drop in Q4 certainly signals markets are well positioned for Trump’s trade policies being implemented quickly. But EUR performance ahead will also be driven by domestic fundamental factors that may push EUR/USD further lower but pessimism is very high and we suspect ECB pricing on rate cuts for this year is overdone. The OIS market is priced for the ECB’s policy rate falling to 1.75% but we suspect the ECB will pause cutting sooner, possibly at 2.25% or 2.00%. While trade tariffs will be a drag on growth, still high nominal wage growth and inflation now close to target, real income growth this year should help support domestic demand conditions. The ECB’s sole mandate is price stability and given we have just exited the largest global inflation shock since the late 1970’s/early 1980’s we do not envisage the ECB rushing into accommodative territory until a pause and thorough assessment.
Germany remains in a flump but there’s a possibility that a change in government may help trigger some pick-up in growth. A general election on 23rd February should result in a CDU/CSU-led coalition government, which based on its election manifesto will mean household and corporate tax cuts and steps to ease red-tape burden on companies that is undermining competitiveness. The constitutional debt brake could also be suspended. The downside political risk for EUR stems from France. There is a danger that Marine Le Pen votes down President Macron’s second government in France that could increase speculation of an early presidential election. A guilty verdict for Le Pen seems plausible based on media reports and a ban from office is possible as is another parliamentary election after July. All scenarios for France this year point to uncertainty but we do not believe President Macron will stand down.
EUR/USD starts this year at levels close to parity with levels implying Trump’s trade policies are well priced. We suspect that support from real incomes is being under-estimated and once we have confirmation of Trump’s tariff action we see scope for EUR/USD to recover in H2 2025.
INTEREST RATE OUTLOOK
|
Interest Rate Close |
Q1 2025 |
Q2 2025 |
Q3 2025 |
Q4 2025 |
|
|
Policy Rate |
3.00% |
2.50% |
2.00% |
2.00% |
2.00% |
|
3-Month Bill |
2.73% |
2.20% |
1.80% |
1.90% |
1.90% |
|
10-Year Yield |
2.43% |
2.20% |
2.10% |
2.20% |
2.30% |
* Interest rate assumptions incorporated into MUFG foreign exchange forecasts.
The 10-year bund yield increased in 2024, by 35bps to close at 2.37%. On a closing basis, the range for the 10-year bund yield was 2.02% to 2.69% so the closing level was close to the mid-point of the range for the year as a whole. The move higher in the 10-year bund yield last year was more subdued than in the US or UK with weaker economic growth and more subdued inflation depressing the move higher. The ECB was more active than the BoE in cutting rates and for this year market pricing indicates more cuts by the ECB than the Fed. Economic growth has been undermined by the lack of political leadership at the heart of the euro-zone with Germany in political gridlock and France political uncertainty high after elections last summer. We expect annual CPI to stabilise at around the 2% target level this year and for the ECB to ease further with the policy rate set to fall to 2.00%. The OIS is therefore a little over-priced for rate cuts which should mean we see some upward pressure on yields at the short-end of the curve later in the year. Given out UST bond yield forecasts we see scope for a moderate move higher in 10-year bund yields.
ECB ASSET PURCHASE PROGRAM BREAKDOWN
Source: Bloomberg, Macrobond
10-YEAR BUND YIELD VS. ECB POLICY RATE

Source: Bloomberg, Macrobond
Pound Sterling
|
Spot close 31.12.24 |
Q1 2025 |
Q2 2025 |
Q3 2025 |
Q4 2025 |
|
|
EUR/GBP |
0.8295 |
0.8250 |
0.8200 |
0.8200 |
0.8300 |
|
GBP/USD |
1.2538 |
1.2000 |
1.2440 |
1.2800 |
1.3010 |
|
GBP/JPY |
196.57 |
184.80 |
189.10 |
192.10 |
192.60 |
|
Range |
Range |
Range |
Range |
||
|
GBP/USD |
1.1800-1.2700 |
1.2000-1.2900 |
1.2200-1.3200 |
1.2400-1.3400 |
MARKET UPDATE
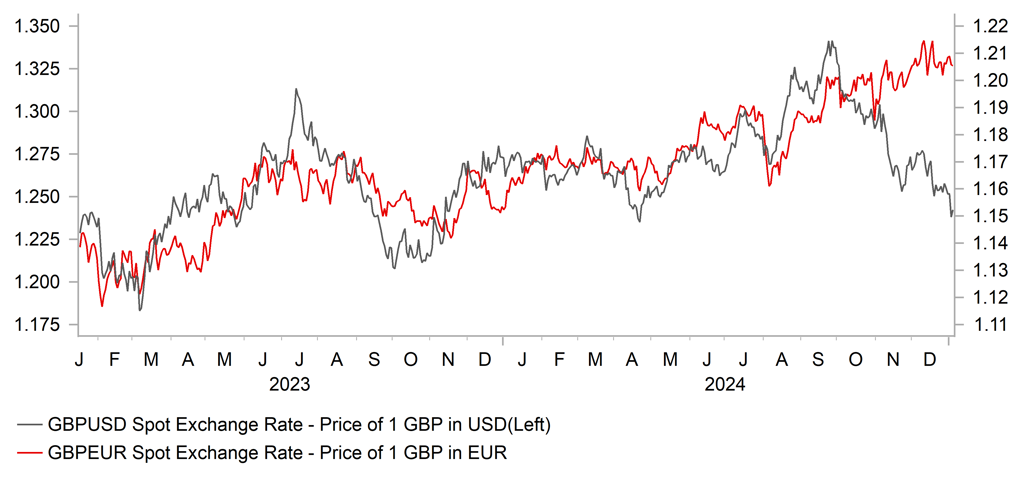
In 2024 the pound weakened against the US dollar in terms of London closing rates from 1.2739 to 1.2538. The intra-day high was 1.3434 in September and the intra-day low was 1.2300 in April. However, the pound strengthened against the euro from 0.8681 to 0.8295. The intra-day high was 0.8683 in January, and the intra-day low was 0.8225 in December. The MPC after raising the Bank Rate aggressively by 515bps from late 2021 through 2023, the BoE began reversing its restrictive stance cutting by 25bps on two occasions – in August and November – taking the key policy rate to 4.75%. The BoE confirmed the continuation of the current QT policy by extending for 12mths from October 2024 the policy of allowing the stock of Gilts to decline by GBP 100bn through a combination of maturing securities and outright sales. The assets on the BoE’s balance sheet declined by GBP 87bn in 2024.
OUTLOOK
The pound advanced by over 5% in 2024 through to end September but then the Trump trade took hold and by year-end, GBP/USD was down 6.4% in Q4. For the year as a whole though GBP was the next best performing G10 currency after the US dollar and was down just 1.7% versus the dollar. Much of the good performance into September reflected a macro backdrop that was much better than expected – real GDP growth expanded 0.7% in Q1 and initially 0.5% in Q2 (revised to 0.4%) which was much stronger than expected at the start of the year. Real GDP is expected to be around 0.8% last year and accelerate to 1.3% this year, less than the 1.5% expected by the BoE. Trade uncertainty will weigh on performance to some degree although the direct impact from trade tariffs will be smaller for the UK than many other large economies. The US actually runs a trade surplus with the UK and two-thirds of trade is in services. The NICs increase could weigh on UK corporate sentiment and weaken the UK labour market further. Overall the budget last year implies mild fiscal consolidation, especially in H2 2025.
The BoE’s MPC was more cautious in cutting rates last year which helped support GBP. We see that caution giving way and cuts will be more aligned this year to actions taken by the Fed and the ECB. There is a risk later this year the MPC is more active than we assume. Our current assumptions imply 50bps more cuts than priced. The 6-3 vote in December highlights the overall composition of the MPC is shifting a little more dovish. Key remains wage growth and while the labour market data is less reliable the PAYE jobs data does point to weakening labour demand. The 6mth MAV PAYE employment change fell to nearly -8k in the latest data. Wages growth should slow from here especially given the NICs increase. That will allow the MPC to cut by at least 100bps this year.
Given our broader US dollar view we see scope for GBP/USD to recover this year. We believe the rates market is under-priced for BoE rate cuts and that should mean lower yields helps GBP underperform, resulting in EUR/GBP drifting higher.
INTEREST RATE OUTLOOK
|
Interest Rate Close |
Q1 2025 |
Q2 2025 |
Q3 2025 |
Q4 2025 |
|
|
Policy Rate |
4.75% |
4.50% |
4.00% |
3.75% |
3.75% |
|
3-Month Bill |
4.75% |
4.40% |
3.80% |
3.60% |
3.60% |
|
10-Year Yield |
4.59% |
4.30% |
4.10% |
4.20% |
4.40% |
* Interest rate assumptions incorporated into MUFG foreign exchange forecasts.
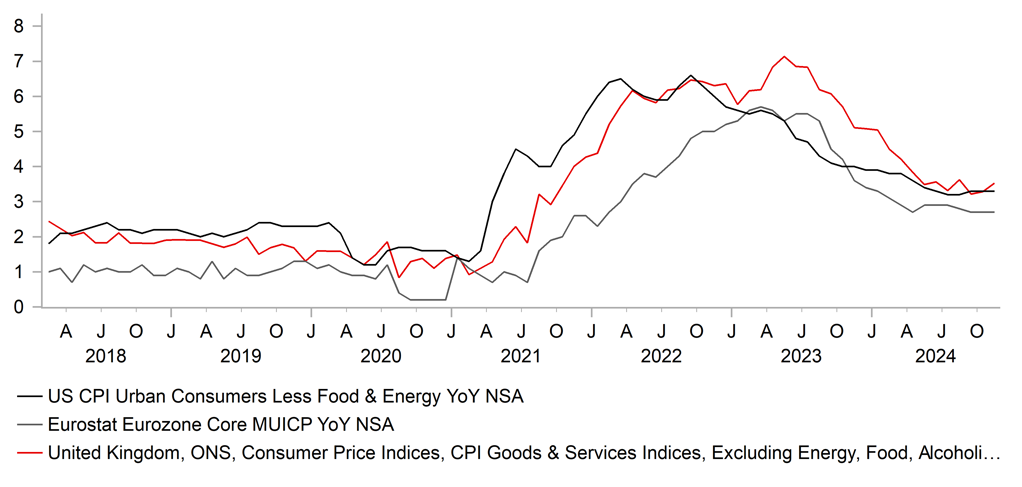
The 10-year Gilt yield jumped notably in 2024, rising by 103bps to close at 4.57%. For much of last year the UK grappled with stickier underlying inflation driven in part by a tighter labour market and higher wage growth. UK growth outperformed in H1 before slowing in H2 but overall growth, expected to be 0.9%, was much stronger than expected at the start of the year. The market consensus for real GDP growth was just 0.3% at the start of last year. Stronger growth and stickier underlying inflation resulted in the BoE being much more cautious in cutting rates. We expect the BoE to be more active this year as the labour market softens and wage growth slows, helping to bring down services inflation. We expect the MPC to cut rate on four occasions this year, by 100bps in total. That would still leave the monetary stance mildly restrictive in our view. The UK budget in October resulted in an increase in Gilt issuance of nearly GBP 20bn to GBP 197bn and the OBR described the budget as “one of the largest fiscal loosenings of any fiscal event in recent decades”. This will limit the scope for 10-year yields to drop this year but assuming 100bps of cuts and easing inflation, we expect to see some modest declines.
GBP/USD VS. GBP/EUR
Source: Bloomberg, Macrobond
UK CPI VS. US CPI VS. EZ CPI
Source: Bloomberg, Macrobond
Chinese renminbi
|
Spot close 31.12.24 |
Q1 2025 |
Q2 2025 |
Q3 2025 |
Q4 2025 |
|
|
USD/CNY |
7.2993 |
7.4000 |
7.5000 |
7.5000 |
7.4000 |
|
USD/HKD |
7.7661 |
7.7900 |
7.7800 |
7.7700 |
7.7700 |
|
Range |
Range |
Range |
Range |
||
|
USD/CNY |
7.1000-7.6000 |
7.2000-7.7000 |
7.2000-7.7000 |
7.1000-7.6000 |
|
|
USD/HKD |
7.7600-7.8400 |
7.7500-7.8300 |
7.7500-7.8300 |
7.7400-7.8200 |
MARKET UPDATE
In 2024, the Chinese yuan weakened by 2.8% against the US dollar, with USD/CNY moving from 7.1012 to 7.2993. Last year, the PBOC cut the benchmark 7-day reverse repo rate by 10bps in July and 20bps in September, bringing the policy rate to 1.50%. In 2024, PBOC also cut RRR by 100bps, 1Y MLF rate by 50bps to 2.0%, 1Y LPR and 5Y LPR by 35bps and 60bps to 3.10% and 3.60% respectively.
OUTLOOK
In 2024, China’s economy started with strong 5.3%yoy growth in Q1 followed by weaker prints of 4.8%yoy in Q2 and 4.6%yoy in Q3. While the government had acted more decisively to support growth since September through rolling out a set of quite comprehensive policies including monetary policy easing, the overall recovery in Q4 was rather muted and November’s macroeconomic data pointed to still insufficient domestic demand with retail sales growth decelerating to 3.0%yoy and new home prices continuing to decline. Deflationary pressures intensified with CPI edging lower and retail sales growth slowed after two months of acceleration. In contrast, a rebound of property sales and floor space sold to positive growth suggests an early sign of the housing market bottoming out, though property investment growth should still likely contract given elevated housing stock. For 2025, we expect more policies to come, due to the positive tone of December’s Politburo meeting (Dec 09) and annual CEWC (Dec 11-12). The government vowed to “keep employment and prices generally stable” in 2025 and stimulating domestic demand is the top priority. The meetings mentioned to adopt a “more proactive” fiscal policy, for the first-time since Covid, and to set a higher deficit-to-GDP ratio, among others. It will also implement a special campaign dedicated to stimulate consumption and expand existing equipment upgrades and consumer goods trade-in programs to stimulate demand.
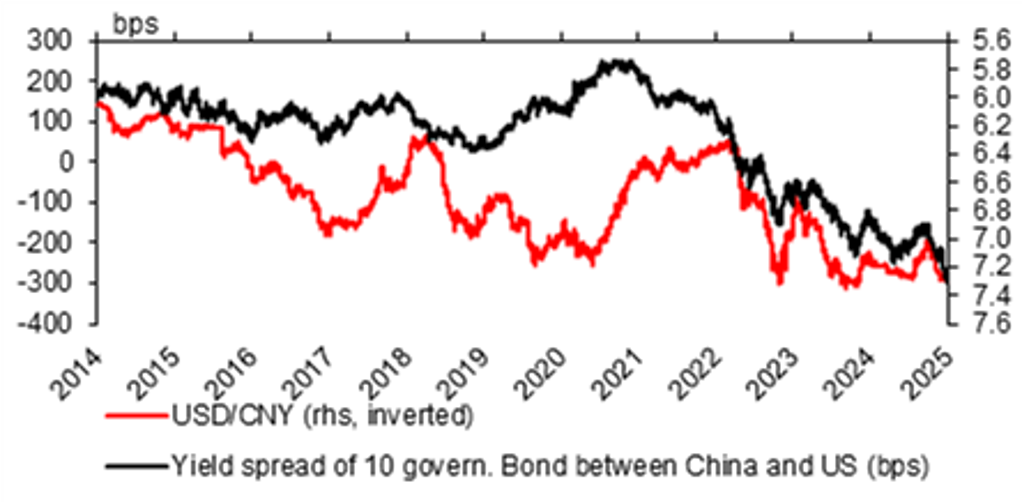
For March’s NPC meeting, we expect a 5.0% growth target set for 2025, to provide some upbeat sentiment and show government’s determination, amid the strong headwinds from Trump’s tariffs on China’s goods. However, given a potential lengthy destocking process of property inventory and lacking of easy levers to quickly turnaround domestic economy, China’s GDP growth may eventually end with a 4.5%yoy GDP growth for 2025. We assume phased tariffs on China and the first batch could start as soon as Trump takes the office. Despite declining from 2017’s 21% to current 13%, China’s exports exposure to US demand is still large, especially considering those indirect exports to US. For USD/CNY, with our assumption of US’s average tariffs on imports from China increasing from 19% to 40% during Trump’s first half year, we expect the USD/CNY to reach 7.4000 by Q1 and 7.5000 by Q2. Our forecasts also reflects US dollar weakening from Q2 onwards. Risks to our call on USD/CNY hinge on the magnitude and timing of the tariffs, and also the US dollar’s actual path in 2025. A sizeable negative China-US yield spread may persist in 2025 and keep USD/CNY at elevated levels.
INTEREST RATE OUTLOOK
|
Interest Rate Close |
Q1 2025 |
Q2 2025 |
Q3 2025 |
Q4 2025 |
|
|
LPR 1Y |
3.10% |
2.90% |
2.70% |
2.70% |
2.70% |
|
MLF 1Y |
2.00% |
1.70% |
1.50% |
1.50% |
1.50% |
|
7-Day Repo Rate |
1.50% |
1.30% |
1.10% |
1.10% |
1.10% |
|
10-Year Yield |
1.68% |
1.60% |
1.60% |
1.70% |
1.80% |
* Interest rate assumptions incorporated into MUFG foreign exchange forecasts.
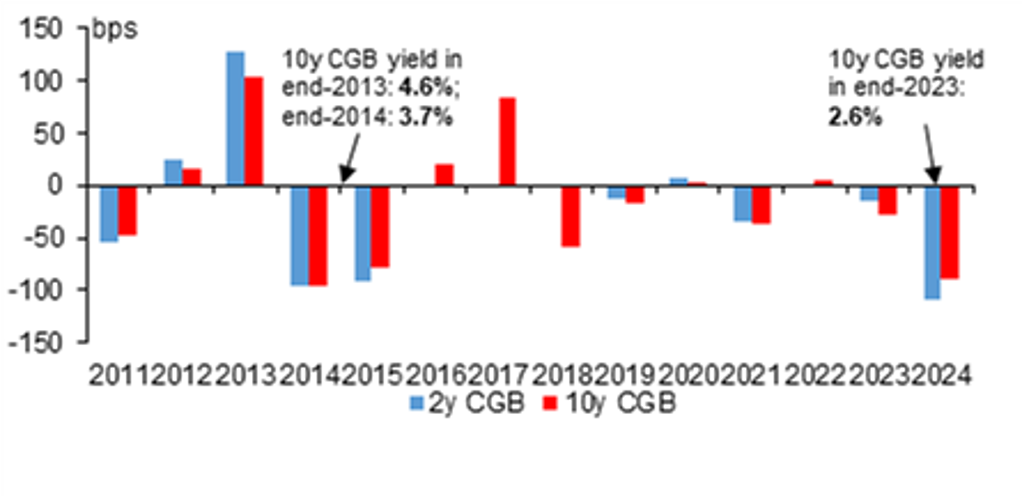
In 2024, China’s government bonds staged a strong rally across the curve with 10y CGB yield down by 89bps to 1.68%, a historical low. In fact, a strong bond rally is not new as it happened at similar magnitude in 2014 and 2015 also driven by deflationary concerns and overcapacity issues, but the bond yield starting points were higher compared to 2024 (4.6% in end-2013; 3.7% in end-2014 vs 2.6% in end-2023). This highlights a stronger deflationary pressure, weaker growth prospect and domestic sentiment today than in 2014/2015. The shift of monetary policy stance to “moderately loose” – the first time since the GFC, and the vow to reduce RRR and interest rates at an “appropriate time” from December’s Politburo meeting and annual CEWC highlight the government’s easing stance in 2025, which pushed the 10-year CGB yield lower in December (-36bps). We expect the PBoC to deliver a 40bp cut on 7-day reverse repo rate to 1.10% in 2025, as well as 50-75bps RRR cut to partly ease the liquidity condition from the planned increased government bond issuance in 2025. We forecast 10y CGB yield to reach 1.60% in Q1 2025 and 1.80% at end-2025.
CHINA-US NEGATIVE YIELD SPREAD WIDENED TO 289BPS IN END-2024
Source: : Bloomberg, MUFG GMR
STRONG CGB RALLY IN 2024, SIMILAR TO THAT IN 2014 AND 2015
Source: : Bloomberg, MUFG GMR

