Higher carry creates better risk-return asymmetry across EMs
Macro focus
With the Fed now in the home stretch alongside US growth that remains low (but non-recessionary), interest in the EM carry is front and centre of attention. We recently catalogued that relatively high EM front end rates both in nominal and real terms compared to DMs argue for EM carry trades in high yielders in a foggy macro environment (see here). Given this backdrop, and our expectation for a shallow and bumpy US dollar outlook, demand for carry has emerged as the driving factor for EM investment in 2023, with the prospect to better protect creditors from adverse movements in domestic currencies, credit spreads and bond yields. The EM local currency liquid government bond index has already generated 166bps of coupon income in 2023, as contribution to return from carry is running ~2x as fast as the 10 year average. On net, higher coupon income reduces the downside risk, improves the total return asymmetry and enables creditors to better withstand unfavourable developments in both spread and duration.
FX views
Emerging market currencies have suffered a setback over the past week as the USD has staged a modest rebound, supported by a pick-up in US yields. The US rate market has moved to fully price in one final 25bps Fed hike next month and scaled back expectations for rate cuts later this year to just over 25bps. While risk assets are still holding up relatively well, safe haven demand is not sufficient yet to support a stronger USD, in our view. Meanwhile, the disappointing price action for the KRW provides further evidence that China reopening trades are struggling to regain upward momentum this year. Asian currencies have on the whole failed to strengthen further against the USD even as it weakened more broadly. Even the release last week of the stronger activity data from China failed to provide a fresh catalyst for Asian currency strength.
Trading views
The last week has seen some good volatility come through on local themes but overall not too much change on the overall macro environment. Risk indicators continue to flash complacency warnings and positioning in USD is becoming stretched. However this “contrarian” concern seems commonplace and equities continue to hum along. Current pricing for the US seems benign enough that we can have a bit of time before deciding one way or the other. With the number of rate cuts significantly reduced we can wait a bit of time before deciding if it is the Fed or the market that is more prescient in its forecasts. Where EM has weakened mostly it has been due to local factors – on a medium term perspective, the one region that continues to underperform in EMFX is Asia. Poor export figures, equity outflows and a significant carry disadvantage are all contributing to the underperformance.
Week in review
South Africa’s inflation edged higher from 7.0% y/y in February to 7.1% y/y in March, reinforcing prospects for the SARB to deliver an additional rate hike of 25bp next month to a terminal rate of 8.00%. Saudi Arabia’s trade balance gained in February despite lower oil revenues. Finally, inflation in Dubai eased by 0.6ppts to 4.3% y/y in March due to a deceleration in core momentum and to a sizable base effect.
Week ahead
This week we will have rate meetings in Hungary (13.0%), Turkey (8.5%) and Russia (7.5%) – we are aligned with consensus in expecting all to be on hold. Key focus is in Hungary with the central bank set to take the first step towards easing this week with Deputy Governor Virag signalling that the collaterised loan rate (which sets the upper bound of the rates corridor), will be lowered from its current level of 25.0%. Beyond EMs, we are focusing on European CPI (notably Germany, France, Spain and Italy). In the US, we have Q1 2023 GDP and PCE prints as well as Fed survey releases.
Forecasts at a glance
Whilst EMs continue to grapple with much the same themes at the turn of the year, we view the outlook as a tale of two halves in 2023. A fading boost from reopenings, a global manufacturing cycle downturn and tighter financial conditions are lumpy headwinds that will weigh on EM prospects in the first half of 2023. However, China’s zero COVID policy exit, the eventual end of rate hikes and a US dollar peak, all offer significant tailwinds to the EM complex in the second half of 2023 (see here).
Core indicators
While the cycle is still positive, March witnessed retrenchment in EM capital flows, down to USD9.4bn, with investors beginning to take a more cautious approach to EM assets as an early year rally ebbs.
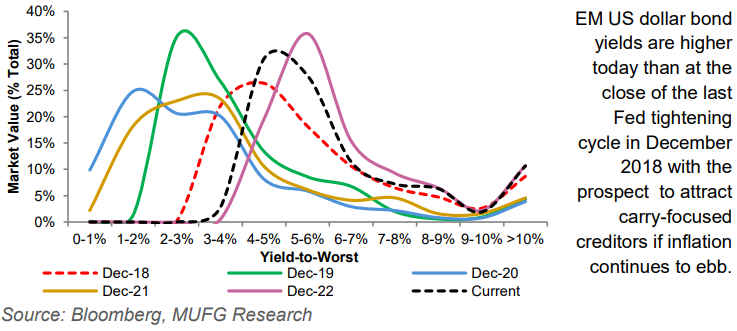
CHART OF THE WEEK: EM RISK PREMIUMS EXPAND IN US DOLLAR CREDIT
EM US DOLLAR CREDIT – HISTORICAL YIELD RANGE (MARKET VALUE VS YIELD-TO-WORST)